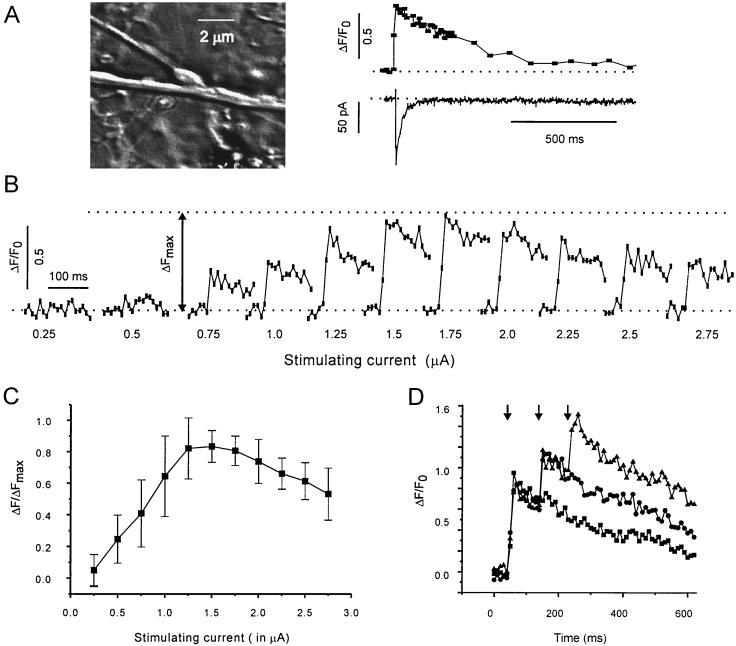
Figure 3.
Presynaptic Ca2+ signals in response to brief electrical stimulation of an isolated bouton. (A) Temporal relationship of an individual [Ca2+]pre transient and the corresponding eIPSC. Depolarizing pulse: 2 μA, 1 ms. Note that the [Ca2+]pre transient significantly outlasted the postsynaptic response. (B) Dependency of [Ca2+]pre on stimulus intensity. Stimulus strength is given below each trace. Pulse duration: 3 ms. (C) Statistical representation of the same protocol as in B (n = 7). The recordings from each bouton were normalized by the maximal response (ΔFmax). Note that the amplitude of [Ca2+]pre decreased when stimulus intensity exceeded 2 μA. (D) Test for indicator saturation. The bouton was stimulated with a series of 1–3 stimuli (3 ms at 0.1 s−1). Pulse intensity (1.5 μA) was chosen to elicit maximal [Ca2+]pre (see C). Note additional increase of fluorescence after the second and third pulse.

