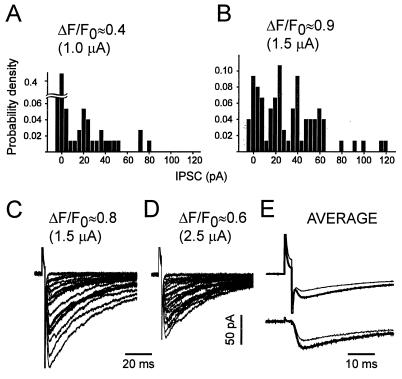
Figure 5.
In any given synapse, the largest eIPSC values obtained were associated with the highest [Ca2+]pre values, but not the strongest stimulus intensity. (A and B) Normalized eIPSC histograms associated with smaller and larger [Ca2+]pre in response to low-frequency stimulation (3 ms, 0.1 s−1) at two different intensities. Pulses of 1 (A) and 1.5 (B) μA were applied to the same bouton in an alternating fashion. Bin width = 4 pA; n = 75. (C and D) Similar experiment in another bouton, but using stimulus intensities of 1.5 μA (C) and 2.5 μA (D). Pulse duration, 2 ms. C and D show 20 randomly selected traces each (n = 70). (E) Averaged traces corresponding to the experiment of C and D. Note that the stronger pulse (thin line) induced the smaller, averaged eIPSC. (Lower) The same traces as in Upper but after the artifact subtraction as described in Materials and Methods.

