Figure 4.
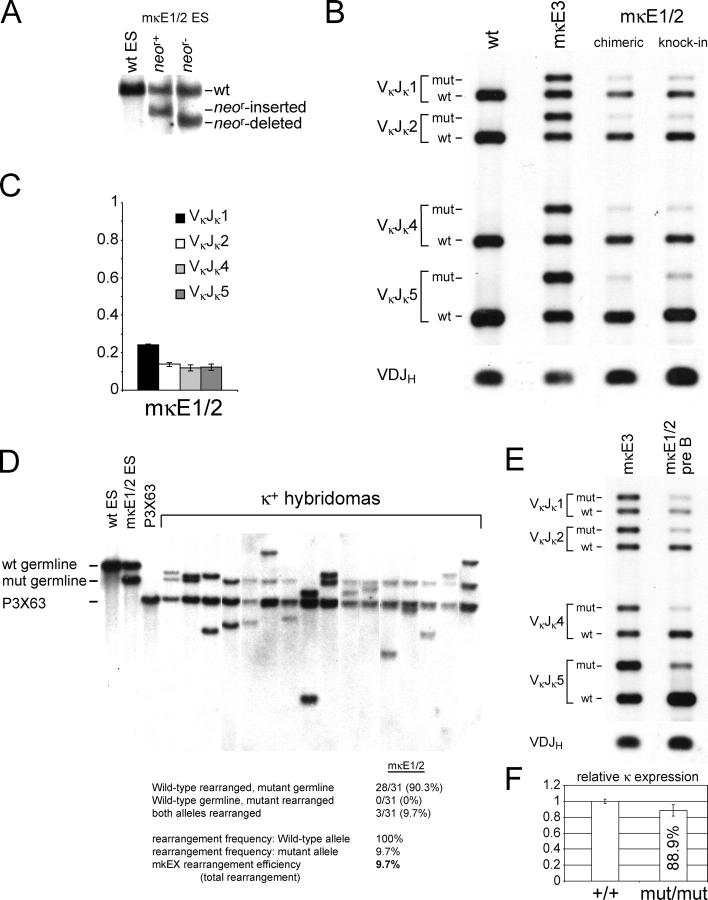
Impacts of the κE1/κE2 double mutation (mκE1/2) on κ rearrangement. (A) Southern blotting analyses of mκE1/2 heterozygous ES cells. The enzymes and probe used are the same as in Fig. 1. Genomic DNA derived from WT, PGK-neo r–inserted and PGK-neo r–deleted mκE1/2 ES cells are shown in lanes 1, 2, and 3, respectively. (B) PCR analysis of Vκ Jκ rearrangement at the WT and mutant alleles. The strategy for the rearrangement PCR assay is identical to that described in Fig. 2. Representative data derived from κ+ splenic B cells from mκE1/2–Rag2−/− chimeric mice and heterozygous germline mice are shown in lane 3 and 4, respectively. As PCR controls, PCR products of genomic DNA derived from WT splenic B cells and mκE3 splenic B cells are shown in lanes 1 and 2, respectively. (C) Statistical analysis of the ratio of the rearrangement frequency of the mutant allele versus that of the WT allele. Mean values derived from four independent experiments are shown with error bars. (D) Representative Southern blotting analysis of hybridomas derived from spleen mκE1/2 B cells. Total numbers of the rearranged WT and mutant allele in 31 hybridomas are shown. White lines indicate that intervening lanes have been spliced out. (E) PCR analysis of Vκ Jκ rearrangement of the WT and mutant allele in mκE1/2 pre–B cells (lane 2). As a control, the rearrangement of WT and mutant alleles in mκE3 splenic B cells is also shown (lane 1). (F) Relative κ expression in κ1 B cells derived from WT and mκE1/2 homozygous mutant B cells. κ transcripts were analyzed by quantitative real-time PCR. mRNA levels were normalized to μ expression. Average of three RNA purifications are shown with error bars.

