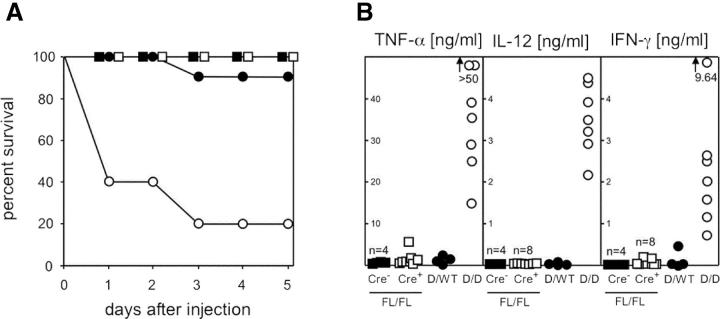
Figure 8.
Response of mice with complete or T cell–specific IL-10 deficiency to LPS. 20 μg of LPS/g body weight were injected i.p. (A) Survival of IL-10 FL/FL CD4-Cre+ mice (□, n = 10) and IL-10 FL/FL Cre− control littermates (▪, n = 10), and IL-10 D/D animals (○, n = 10) and IL-10 D/WT control littermates (•, n = 10). (B) Additional animals were bled 6 h after LPS injection and serum TNF-α, IFN-γ, and IL-12 levels were determined (symbols as in A).

