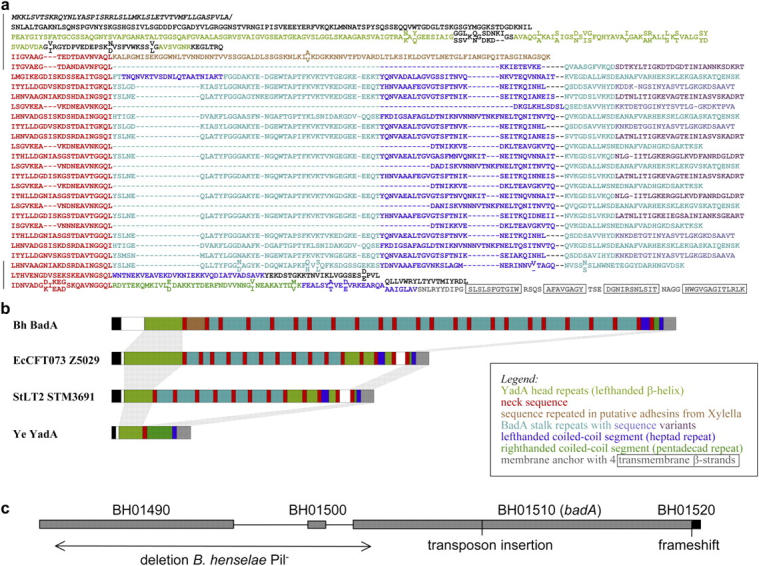
Figure 2.

Protein domain structure of BadA and genomic organization of badA region. (a) Sequence representation and (b) schematic diagram of the BadA domain structure. Individual domains are color coded. For simplicity, the colors are explained in the figure itself. Regions that could not be assigned by sequence similarity are left black in (a) and shown as open boxes in (b). The sequence is BadA of B. henselae Houston-1. Regions also sequenced in B. henselae Marseille are marked by black bars in (a) and residues different in the two strains are shown staggered, with the Houston-1 sequence above and the Marseille sequence below. In (b), structurally equivalent regions are connected by gray bars. The organisms are as follows: Bh, B. henselae; EcCFT073, E. coli strain CFT073; StLT2, Salmonella typhimurium strain LT2; Ye, Y. enterocolitica. (c) Schematic diagram of the arrangement of genes in a 17.7-kb genomic region of B. henselae Houston-1. Details are given in Results. Site of transposon insertion in B. henselae Marseille BadA− and position of the frameshift in the membrane anchor region of B. henselae Houston-1 are indicated. Loss of BadA (pilus) expression in a spontaneous B. henselae Marseille variant (B. henselae Pil−) is correlated with an 8.5-kb deletion (arrow).
