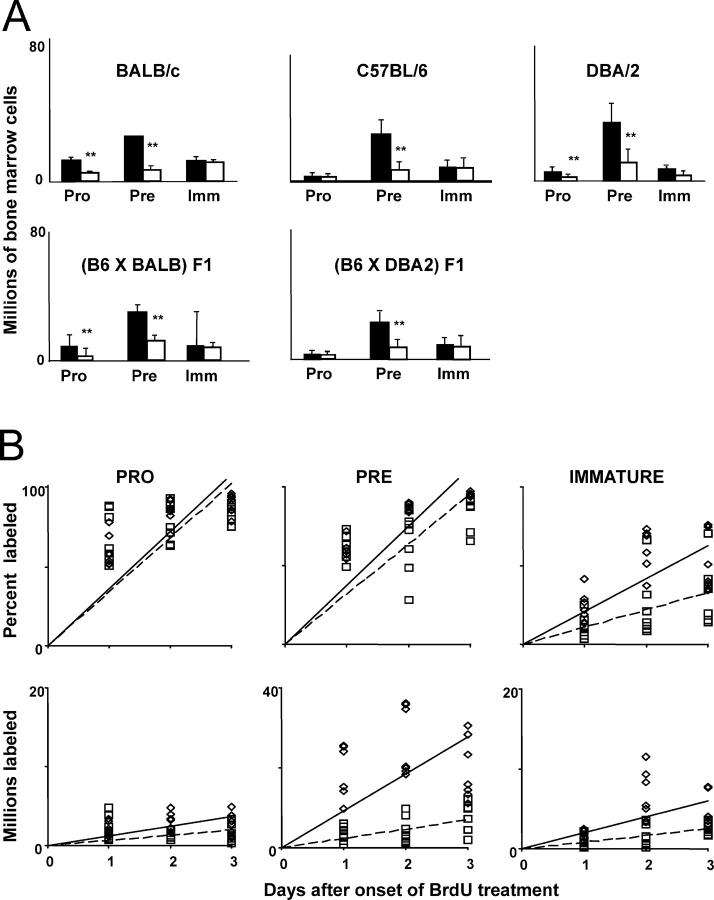
Figure 1.
Magnitude, renewal rates, and production rates of B lineage progenitor pools in aged and young adults. (A) Bone marrow was harvested from either young adult (black bars) or aged mice (white bars) of the strains and F1 combinations indicated and stained as described in Materials and Methods. The proportions of pro–B (IgM−B220+CD43+), pre–B (IgM−B220+CD43−), and immature B (IgM+B220LO) subsets were assessed using flow cytometry and multiplied by the marrow cell estimate of Osmond (reference 50) to obtain total numbers. Bars show mean ± SD of samples from 10 to 30 mice, depending on strain. **, statistical significance for young versus old (Student's t test; P < 0.05). (B) Young adult (diamonds) or aged (squares) C57BL/6 mice were injected with 0.6 mg BrdU at 12-h intervals. Bone marrow was harvested at various times after the onset of labeling and stained for surface phenotype and BrdU incorporation as described in Materials and Methods. The proportion of BrdU-labeled cells (top) was determined using flow cytometry, and the numbers of BrdU-labeled cells (bottom) were calculated by multiplying these proportions by the Osmond estimate of total marrow cells. Labeling among pro–B, pre–B, and immature B cell subsets is shown in the left, middle, and right plots, respectively. Each point represents an individual mouse. Solid and dashed lines (young and aged, respectively) are those determined by linear regression.

