
Figure 6.
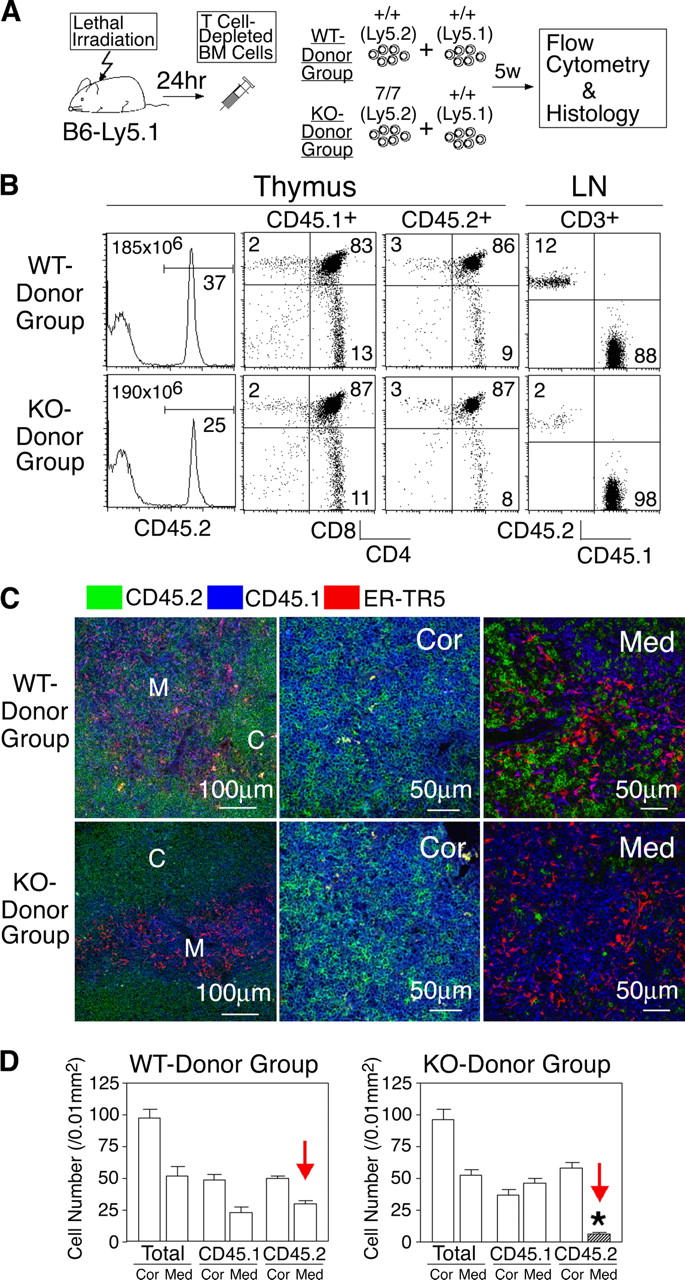
Intrathymic distribution of CCR7-deficient thymocytes in mixed bone marrow chimeras. (A) Scheme of the experimental protocol. (B) Flow cytometric analysis of thymocytes and lymph node (LN) cells. Where indicated, cells were gated for CD45.1+, CD45.2+, and CD3+ populations. Means of total thymocytes are also shown in histogram panels. (C) Three-color immunofluorescence analysis of thymus sections for CD45.2 (green), CD45.1 (blue), and ER-TR5 (red). (D) Means ± SEs of the numbers of total, CD45.1+, and CD45.2+ cells per unit area (0.01 mm2) of indicated regions of thymus sections are indicated. C and Cor, cortex; M and Med, medulla. *, P < 0.001.