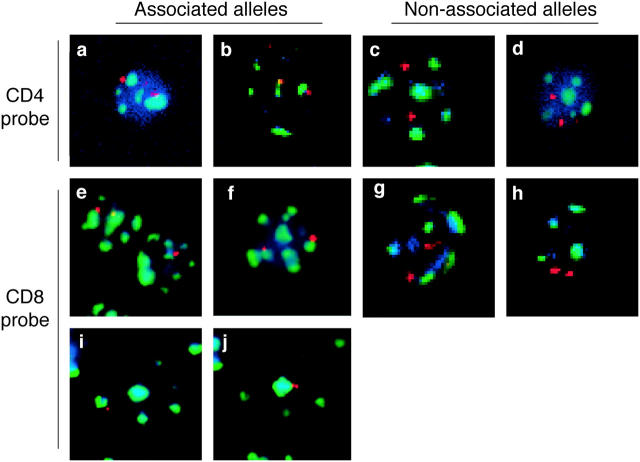
Figure 1.
Analysis of the position of CD4 and CD8 alleles relative to heterochromatin using FISH analysis. Thymocyte or T cell populations were isolated and analyzed by FISH using probes for either CD4 (a–d) or CD8α (e–j) genes (red). Samples were costained with probes for γ satellite DNA (green) as a marker for heterochromatin as described in Materials and Methods. DAPI staining (blue) is included to help locate the nucleus. Examples of associated alleles are shown on the left and examples of nonassociated alleles are shown on the right. Representative deconvolved fluorescent images are shown for the following samples: (a) CD4− CD8− thymocytes from RAG-1− mice, (b) CD4+ CD8+ thymocytes from P14 TCR transgenic mice, (c) CD4+ CD8− LN T cells from wild-type mice, (d) CD4+ CD8+ thymocyte from F5 TCR transgenic mice, (e) CD4− CD8− thymocytes from RAG-1− mice, (f) CD4+ CD8− thymocytes from 5CC7 TCR transgenic mice, (g) CD4+ CD8+ thymocytes from wild-type mice, (h) CD4+ CD8+ thymocytes from F5 TCR transgenic mice, (i and j) activated CD4+ CD8− LN T cells. (i and j) Two different focal (z) planes of the same cell taken 1.8 μm apart are shown. Compiled data for percent of alleles associated are shown in Figs. 2 and 3. Note that each image corresponds to a single focal plane, however complete z-series for each cell was recorded and individual alleles were scored as associated or nonassociated with heterochromatin based on examination of all focal planes.

