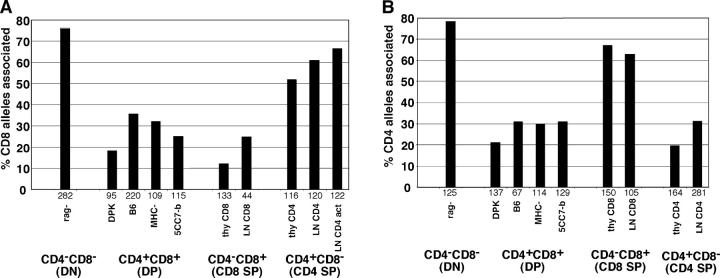
Figure 2.
Dynamic repositioning of CD4 and CD8 genes relative to heterochromatin during T cell development. The indicated thymocyte and T cell populations were isolated and analyzed by FISH using probes for either CD8α (A) or CD4 (B) genes. Samples were costained with probes for γ satellite DNA as a marker for heterochromatin. Individual CD4 or CD8 alleles were scored for association with heterochromatin and the percent of alleles associated with heterochromatin is displayed. The number of alleles scored for each sample is indicated beneath each set of bars. Data are compiled from two to four independent experiments for each sample. Samples are denoted as follows: rag-, thymocytes from RAG-1–deficient mice that were >95% CD4−CD8−; DPK, a CD4+ CD8+ thymocyte cell line (reference 32); B6, isolated CD4+ CD8+ thymocytes from wild-type C57Bl/6 mice; MHC-, isolated CD4+ CD8+ thymocytes from β-2 microglobulin and Ab mutant mice; 5CC7-b, isolated CD4+ CD8+ thymocytes from 5CC7 TCR transgenic mice on a nonselecting (B10) background; thy CD8, isolated CD4− CD8+ thymocytes from F5 TCR transgenic mice; LN CD8, isolated CD4− CD8+ LN cells from wild-type mice; thy CD4, isolated CD4+ CD8− thymocytes from 5CC7 TCR transgenic mice on a positive selecting background (B10.A); LN CD4, isolated CD4+ CD8− LN cells from wild-type mice; LN CD4 act, LN CD4 cells that were activated in the presence of Con A for 2 d. Similar trends are seen when data is scored as percent of cells with one or two alleles associated with heterochromatin (not depicted).

