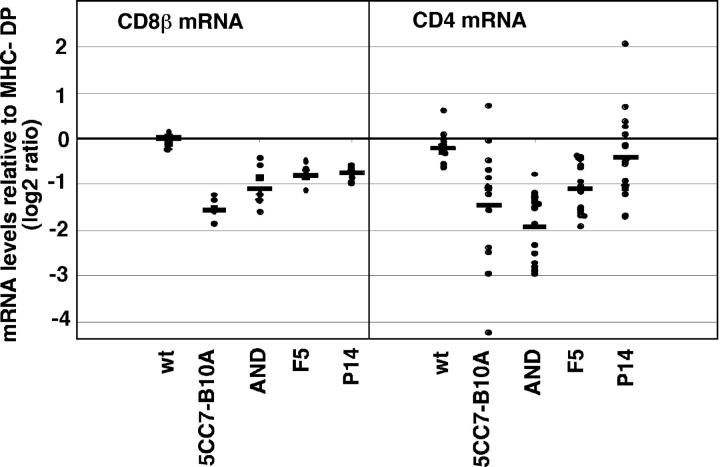
Figure 5.
CD4 and CD8 mRNA levels from DP thymocytes. Values for CD4 and CD8 mRNA levels are from published DNA microarray analysis (reference 35). Data are replotted here to show values for each individual measurement. Data are presented as the log2 ratio of signal from the indicated CD4+ CD8+ thymocyte sample relative to CD4+ CD8+ thymocytes from MHC-deficient mice. Each dot represents the value from an individual spot and the average fold change for all measurements for each sample is shown as a line. Average fold changes for CD8β mRNA were as follows: MHC v B6 0.012(0.15), 5CC7 TCR −1.57(0.26), AND TCR −1.10(0.44), F5 −0.81(0.23), and P14 −0.75(0.16). Average fold changes for CD4 mRNA were as follows: MHC v B6 −0.22(0.33), 5CC7 TCR −1.46(1.30), AND TCR −1.94(0.71), F5 −1.09(0.51), and P14 −0.42(0.880). Standard errors of means are given in parenthesis.

