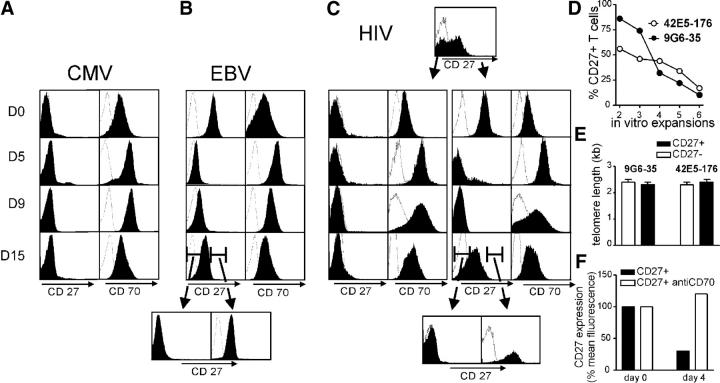
Figure 2.
CD27 expression after T cell activation. Virus-specific clones were expanded with anti-CD3 mAb in the presence of LCLs, irradiated feeder cells, and IL-2. At the time points indicated, (A) CD27− CMV-specific clone MT (and pp270, not depicted) and (B) CD27+ EBV-specific clone EG+4 (and RS+26, not depicted) were analyzed by FACS for CD27 and CD70 expression. (C) HIV gag–specific T cell clone 9G6-35 (and 42E5-176, not depicted), which initially contained both CD27+ and CD27− cells, were sorted and the fate of the CD27+ and CD27− T cells was separately analyzed. (B and C) At the end of a stimulation cycle of initially CD27+ EBV- and HIV-specific cells, the cells were sorted for CD27 expression and the CD27+ and CD27− cells were monitored through the next cycle. (D) The T cell clones 9G6-35 and 42E5-176 were repetitively expanded, and CD27 expression was assessed 14 d after anti-CD3 mAb stimulation. (E) Telomere lengths of CD27+ and CD27− cells at the end of the fifth in vitro expansion were compared. (F) CD27+ T cells from clone 42E5-176 were stimulated by plate-bound anti-CD3 mAb for 4 d in the presence or absence of 5 μg/ml anti-CD70 mAb. Surface expression of CD27 4 d after stimulation is shown.

