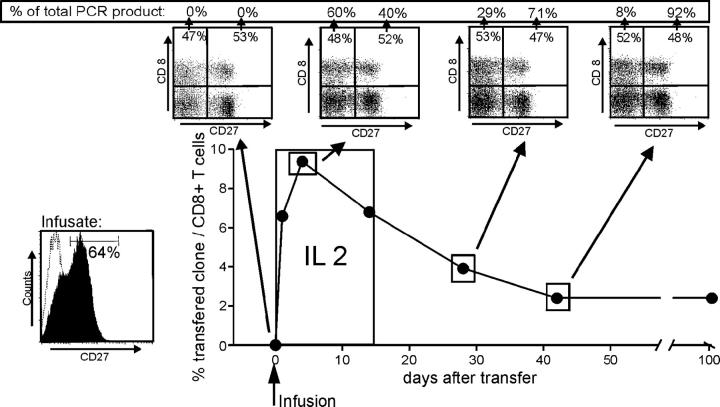
Figure 5.
Frequency and phenotype of HIV gag–specific CD8+ T cell clones after adoptive transfer. Autologous 3.3 × 10⁹/m2 clonal CD8+ T cells were infused on day 0 (clone 9G6-35 from patient no. 15249) followed by a low dose of IL-2 (2.5 × 10⁵ U/m2) injected subcutaneously daily for 14 d. The frequency of the transferred T cells was followed by quantitative PCR specific for the CDR3 region as described in Materials and Methods. At the time points indicated, CD8+ PBMCs were sorted for surface expression of CD27 followed by quantitative clonotypic PCR of the sorted samples. The numbers in the FACS dot plots indicate the percentage of CD8+ T cells, and the numbers given as percent PCR product indicate the percentage of the transferred T cell clone in the CD27+ or CD27− subpopulation.

