
Figure 1.
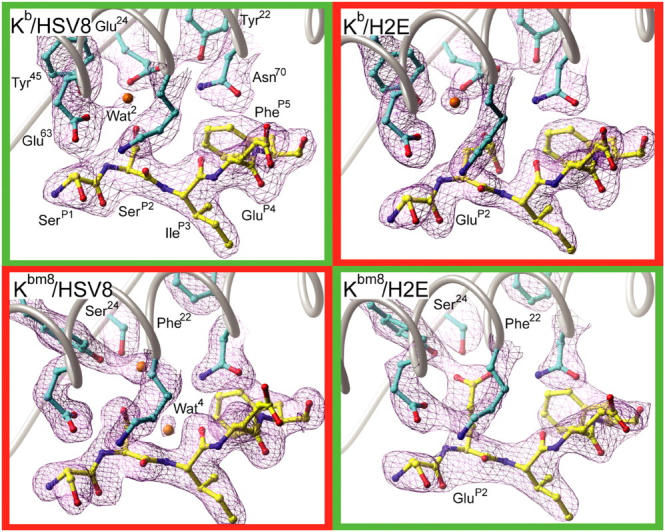
Crystallographic electron density maps of the pMHC B pockets. Sigma-weighted simulated annealing Fo-Fc omit electron density maps contoured at 3.5σ around the B pocket regions of all four pMHCs. (cyan) Kb and Kbm8 carbon; (yellow) HSV8 and H2E peptide carbon; (red) oxygen; (blue) nitrogen; (orange) water. Recognized pMHCs are in green boxes and unrecognized pMHCs are in red boxes.