Figure 7.
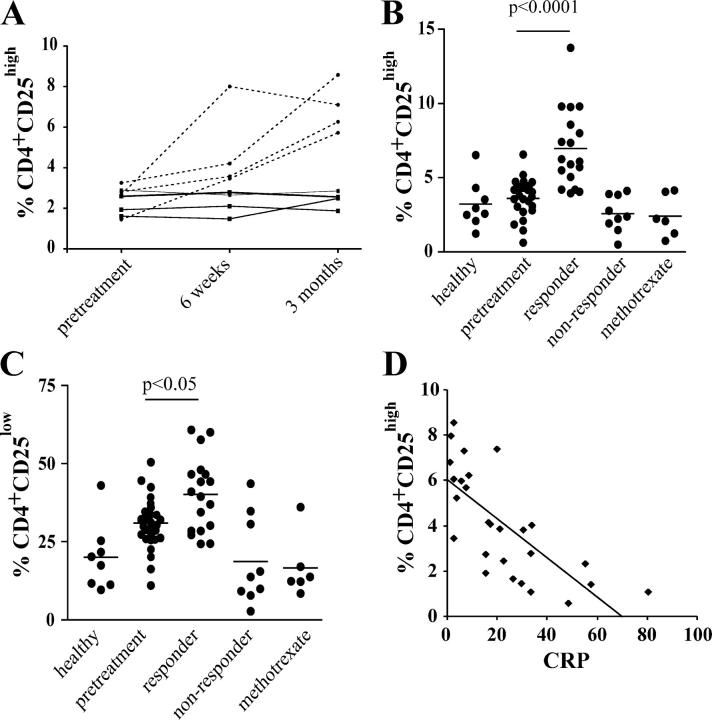
Increase in CD4+CD25high T cells in the PB of RA patients responding to anti-TNFα therapy. (A) The percentage of CD4+ T cells expressing CD25high was followed in four anti-TNFα responder (dashed line) and four nonresponder (solid line) patients with RA before and after treatment. (B) Analysis of larger group of patients treated with anti-TNFα (n = 27), methotrexate alone (n = 6), and healthy controls (n = 8). CD4+CD25high and (C) CD4+CD25low T cells (as defined in Fig. S1 A). (D) Scatter plot showing a significant correlation between the C reactive protein and the percentage of CD4+CD25high T cells before and after treatment (P < 0.001, r2 = 0.5278).

