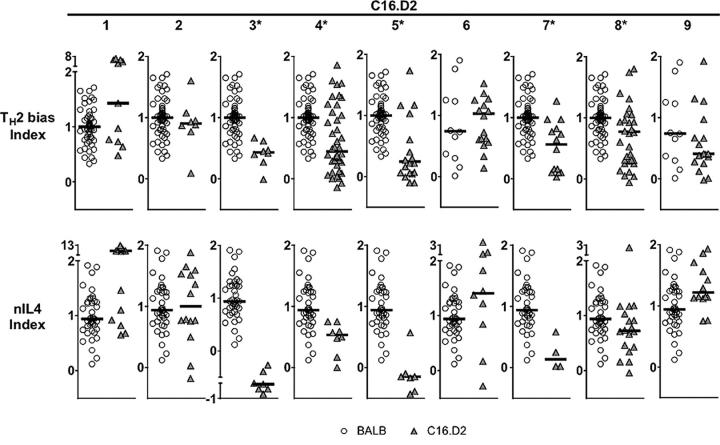
Figure 3.
Concordance between Th2 cell bias and nIL-4 traits among C.16D2 congenic strains. Shown are scatter plots of Th2 cell bias (top) and nIL-4 index values (bottom) of individual BALB/c (open circles) and C.16D2 congenic animals (gray triangles). Data shown are from experiments in which control BALB/c and B10.D2 differed significantly. For Th2 cell bias experiments involving C16.D2 strains 1–5, 7, and 8, P < 0.09; for C16.D2 strains 6 and 9, P < 0.2; and for all nIL-4 experiments, P ≤ 0.1. C16.D2 strains with phenotypes significantly lower than control BALB/c are indicated with an asterisk. Multiple comparison tests of significance were performed using the Mann-Whitney nonparametric test. P-values (Th2 cell bias, nIL-4) are as follows: C16D2/1 (0.5000, 0.500), C16D2/2 (0.7357, 0.8689), C16D2/3 (<0.0001, <0.0001), C16D2/4 (0.0002, 0.0008), C16D2/5 (0.0018, <0.0001), C16D2/6 (0.7884, 0.5000), C16D2/7 (0.0163, 0.003), C16D2/8 (0.0286, 0.0271), and C16D2/9 (0.1304, 0.5000).

