Figure 1.

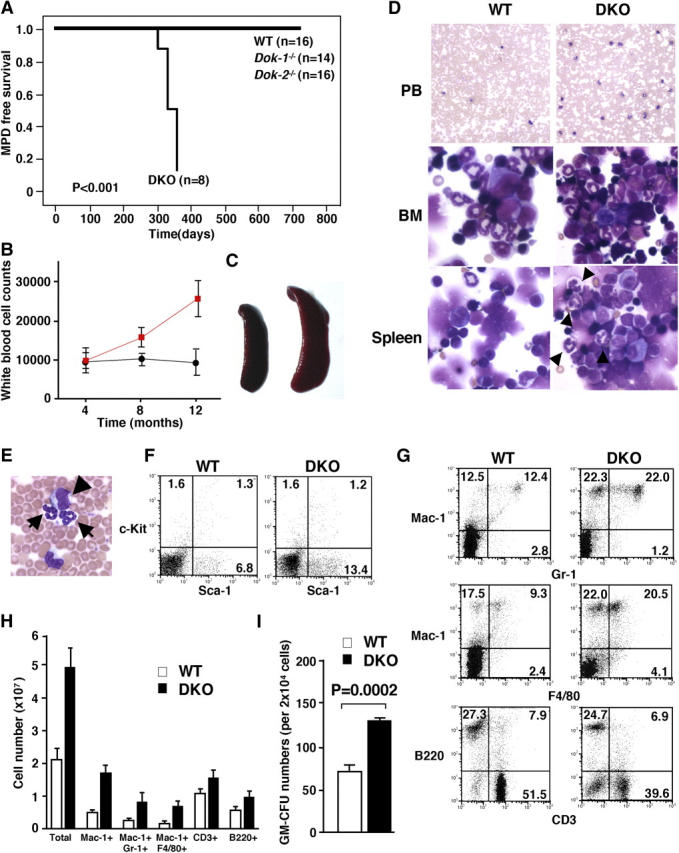
MPD in Dok-1 −/−/Dok-2 −/− mutants. (A) MPD-free survival curve of WT, Dok-1 −/−, Dok-2 −/− single mutants, and Dok-1 −/−/Dok-2 −/− mutant (DKO) mice. (B) Time course of white blood cell counts of WT (black line) and Dok-1 −/−/Dok-2 −/− mutants (red line). (C) Splenomegaly in Dok-1 −/−/Dok-2 −/− diseased mutants. Spleen from 1-yr-old WT (left) and Dok-1 −/−/Dok-2 −/− mice (right). (D) Morphology of PB, BM, and spleen cells from 1-yr-old WT and Dok-1 −/−/Dok-2 −/− mutants (DKO). The smears of PB and cytospins of BM and spleen were stained with Wright-Giemsa stain. Original magnifications: 100 for PB and 400 for BM and spleen. Differentiated granulocytes (arrowheads) are seen in spleen cytospin from Dok-1 −/−/Dok-2 −/− mutant (DKO). (E) High magnification (400) of PB from Dok-1 −/−/Dok-2 −/− mutant. Arrows indicate differentiated granulocytes and arrowhead indicates blast cell. (F) Flow cytometric analysis of PB from a Dok-1 −/−/Dok-2 −/− mutant (DKO) and WT littermate. PB cells were double stained with anti–c-Kit–PE and anti–Sca-1–FITC. Percentages of positive cells are shown in each quadrant. (G) Flow cytometric analysis of splenocytes from a Dok-1 −/−/Dok-2 −/− (DKO) mutant and WT littermate. (H) Absolute numbers of total, Mac-1+, Mac-1+/Gr-1+, Mac-1+/F4/80+, CD3+, and B220+ cells from 1-yr-old WT (white bars) and DKO mutant (black bars). Spleens from three WT and three DKO mutants were analyzed by flow cytometry. The number of positive cells for each marker was calculated. Means and SD are indicated. (I) In vitro colony-forming assay performed with BM cells isolated from a 1-yr-old WT (white bar) and diseased DOK mutant (black bar). P-value is also shown.
