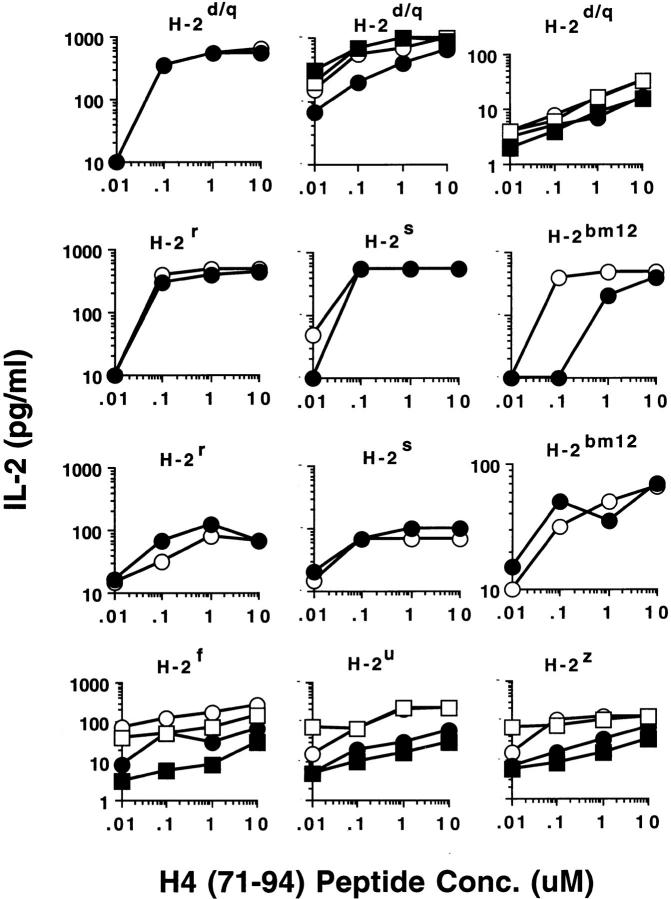
Figure 9.
Effect of the purified anti-CD4 mAb, RM4.5, on the responses of lupus T cells to nucleosomal peptide H471–94. Solid symbols represent anti-CD4 mAb containing cultures and the corresponding cultures without anti-CD4 are designated by open symbols. The MHC haplotypes of different APCs used to present the peptide are shown at the top of each panel; H-2d/q represents syngeneic SNF1 APCs. Background values of IL-2 production in corresponding cultures (T cells + APC) without antigen have been subtracted from each data point. (Top row) Left panel shows 4G4 transfected with 3Aα/3a9β TCRs, middle shows Th clones H/L-3A (circles) and H-15E3 (squares), and right panel shows two short-term, CD4+ T cell lines from SNF1 spleen (squares and circles). Responses of pathogenic autoantibody-inducing Th clones H/L-3A and H-15E3 to nucleosomal peptide presented by different allogeneic APC are shown in second and third rows, respectively, and that of the short-term T cell lines are shown in the bottom row. The anti-CD4 mAb, RM4.5, was used at 1 μg/ml, which is the saturating concentration (25), but similar results were obtained at a concentration of 10 μg/ml. Another anti-CD4 mAb (GK1.5), concentrated 10 and 5 times from culture supernatants by ammonium sulphate precipitations, gave similar results (data not shown). Mean of triplicate assays are shown above. SD <10%.

