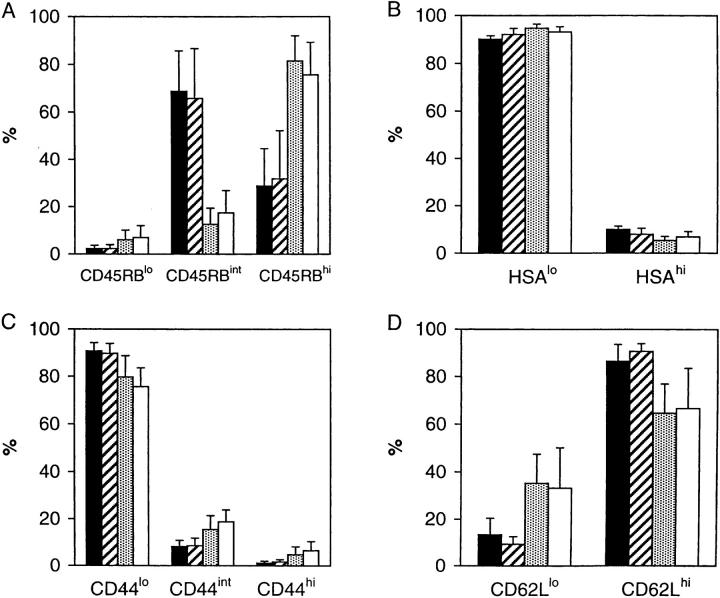
Figure 1.
Phenotype of Vγ2+ T cells in STx and ATx G8 TCR-γ/δ transgenic mice. Data show proportion of Vγ2+ cells expressing different levels of (A) CD45RB, (B) HSA, (C) CD44, and (D) CD62L in pooled LNs (▪) or spleen ( ) of STx mice, or pooled LN (
) or spleen (□) of ATx mice. Data represent mean values ± SD for three (STx) or seven (ATx) mice that had been given BrdU for 4 d.

