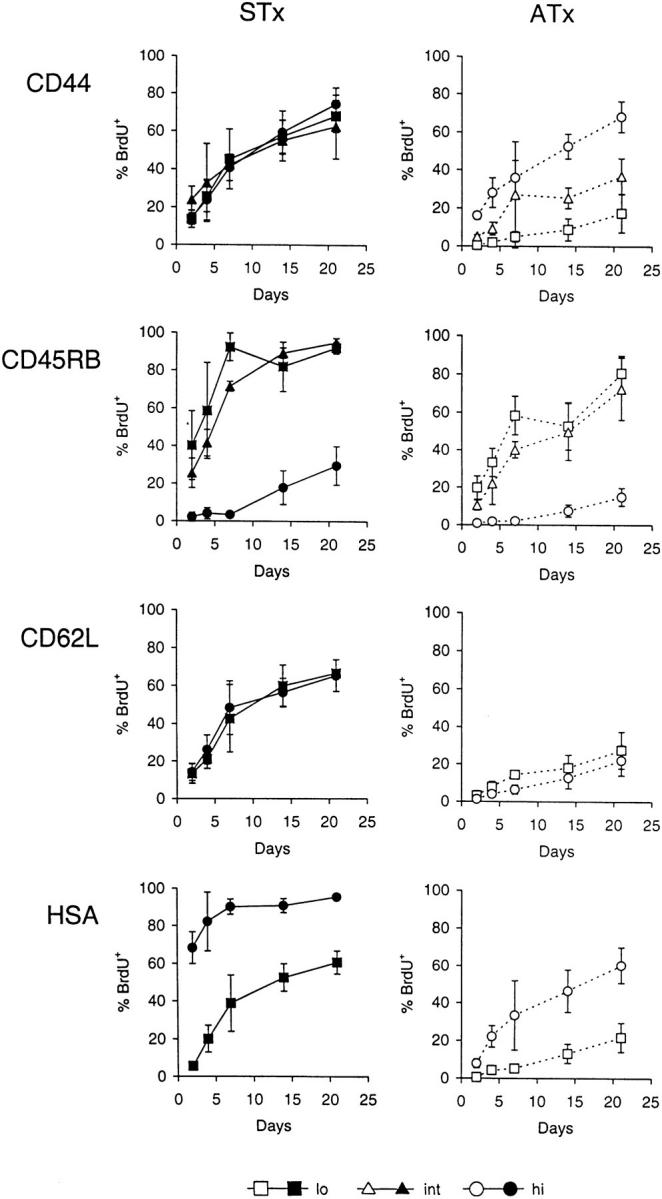
Figure 3.

Kinetics of BrdU labeling of Vγ2+ cells in STx versus ATx G8 TCR-γ/δ transgenic mice. Mice were given BrdU continuously in their drinking water and pooled LN cells were analyzed at the indicated time points. Data show BrdU labeling of subsets of Vγ2+ cells expressing low (lo), intermediate (int), or high (hi) levels of (from top to bottom) CD44, CD45RB, CD62L or HSA in STx (left, closed symbols) or ATx (right, open symbols) TCR-γ/δ transgenic mice. Data represent mean values ± SD of two to seven mice per point.
