Figure 5.
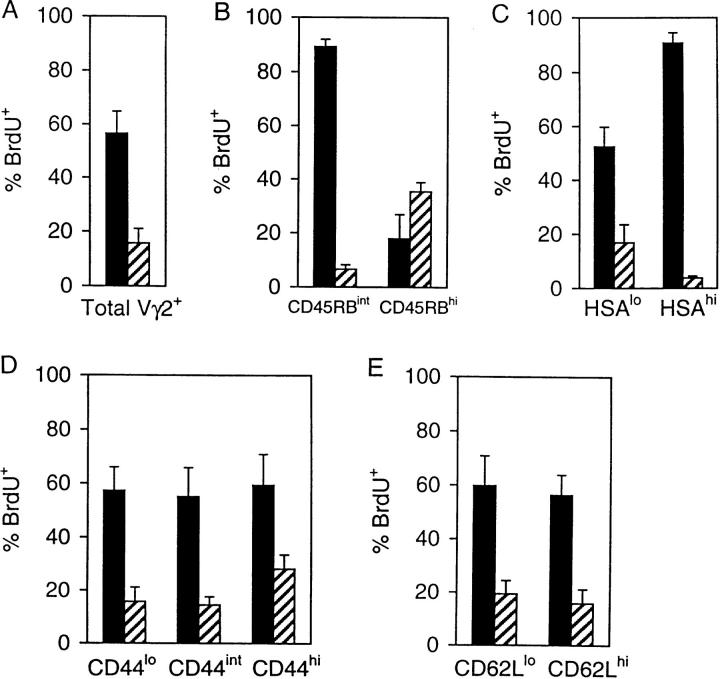
Pulse-chase BrdU labeling of Vγ2+ T cells in STx G8 TCR-γ/δ transgenic mice. Mice were given BrdU for 14 d (▪), or given BrdU for 14 d followed by normal drinking water for 28 d ( ). The percentage of BrdU+ cells in pooled LNs is shown for (A) total Vγ2+ T cells; (B) Vγ2+ T cells expressing intermediate or high levels of CD45RB; (C) Vγ2+ T cells expressing low or high levels of HSA; (D) Vγ2+ T cells expressing low, intermediate, or high levels of CD44; and (E) Vγ2+ T cells expressing low or high levels of CD62L. Data represent mean values ± SD for 7 (14 d BrdU) or 2 (14 d BrdU plus 28 d normal water) mice.

