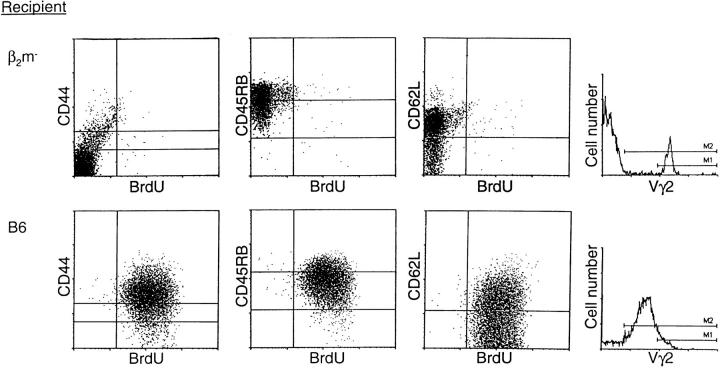
Figure 7.
Phenotype of γ/δ cells activated in vivo. Vγ2+ T cells were purified from G8 TCR-γ/δ transgenic mice and injected into either β2m− (upper) or B6 (lower) mice; recipients were treated with anti–NK-1.1 antibody and irradiated before adoptive transfer (see Materials and Methods). After injection of Vγ2+ cells, recipients were given BrdU for 4 d. Dot plots show staining of spleen cells from representative mice.

