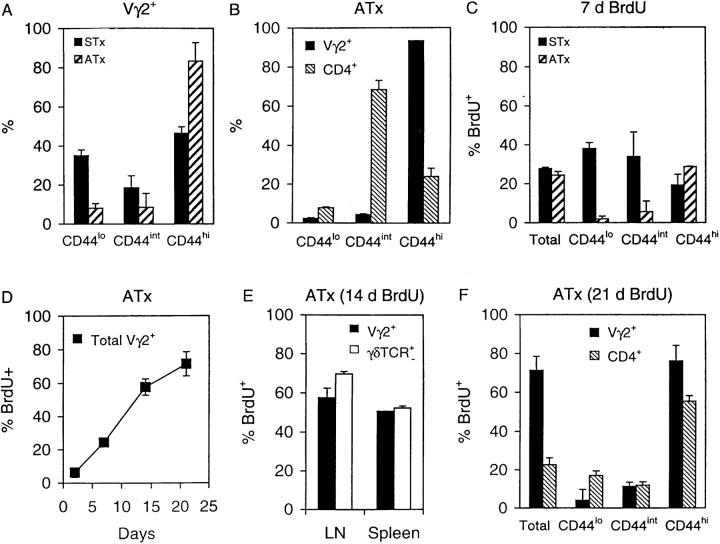
Figure 8.
T cell turnover and phenotype in B6 mice. (A) Percentage of Vγ2+ T cells expressing low, intermediate, or high levels of CD44 in STx and ATx mice. (B) Proportion of Vγ2+ and CD4+ cells expressing low, intermediate, or high levels of CD44 in ATx mice. (C) BrdU labeling of total, CD44lo, CD44int and CD44hi Vγ2+ T cells in STx and ATx B6 mice given BrdU for 7 d. (D) Kinetics of BrdU labeling of total Vγ2+ T cells in ATx mice. (E) Comparison of BrdU labeling of Vγ2+ T cells versus total TCR-γ/δ+ T cells in ATx mice given BrdU for 14 d. (F) BrdU labeling of Vγ2+ and CD4+ T cells expressing different levels of CD44 in ATx mice given BrdU for 21 d. Data shown are for pooled LN cells and represent mean values ± SD for two to three mice per point.

