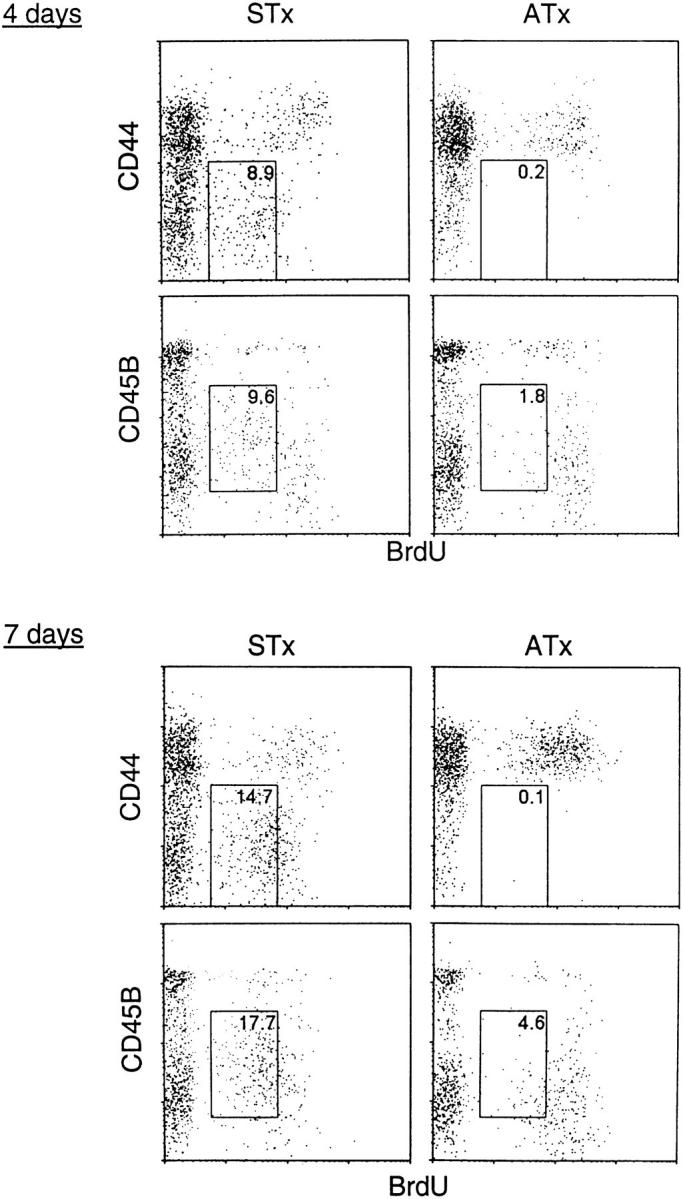
Figure 9.

Phenotype of Vγ2+ RTEs in B6 mice. STx (left) or ATx (right) B6 mice were given BrdU for 4 d (upper) or 7 d (lower). Dot plots show representative staining of Vγ2+ pooled LN cells. The percentage of cells falling within the boxed areas is indicated.
