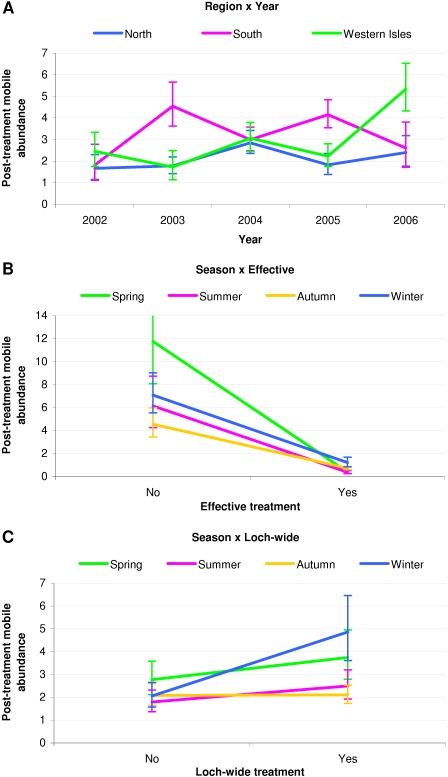
Figure 4. Profile plots for treatment episodes showing post-treatment mobile abundances associated with significant (p<0.05) interaction factors.
Post-treatment mobile L. salmonis abundances with associated 95% confidence intervals. Based on a GLM analysis of data from 108 treatment episodes at 47 Atlantic salmon farms in Scotland in the period 2002 to 2006.

