
Figure 3.

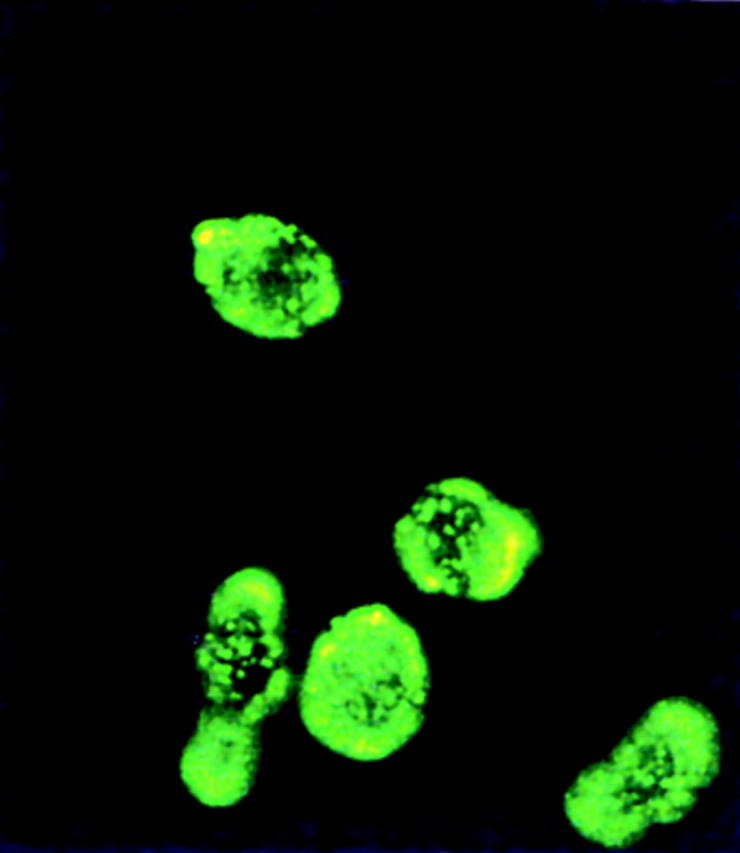


FACS® analysis of cell surface expression of ST2L. (a) Th1 (X4) and Th2 (X12) cells were stained with rabbit anti-ST2L antibody (green) or preimmune rabbit IgG (white) (40 μg/ml) and developed with an FITC-conjugated donkey anti–rabbit IgG. Similar results were obtained for three other Th1 and Th2 clones (not shown). The staining of Th2s (X12) with anti-ST2L antibody can also be visualized by fluorescent microscopy (×400). Staining can be blocked by the ST2L peptide (100 μg/ml) and no staining was detected on Th1s (data not shown). (b) Three-color flow cytometric analysis of Th1 (X4) and Th2 (X12) clones. Th2 (X12) and Th1 (X4) clones were stained for cell surface ST2L (with PerCP), followed by intracellular staining with anti–IL-4 (with PE) and anti–IFN-γ (with FITC). All cells shown in the boxes were activated with PMA/ionomycin. Cells analyzed in boxes (i), (iii), (v) and (vii) were stained with normal rabbit IgG and isotype controls for anti–IFN-γ and anti–IL-4, whereas cells in boxes (ii), (iv), (vi), and (viii) were stained with rabbit anti-ST2L, anti–IFN-γ, and anti–IL-4 antibodies. Cells in boxes (i), (ii), (v), and (vi) have been gated for positive expression of ST2L when stained with anti-ST2L antibody (R3, black) relative to negative staining with control rabbit IgG (R2, gray). Colocalization of R2 and R3 depicts negative expression of ST2L. Cytokines in the culture supernatants (48 h) of T cell clones (106/ml) stimulated with specific antigen and irradiated antigen-presenting cells were (IFN-γ versus IL-4, ng/ml): X4, 5.2 versus <0.02; X12, <0.01 versus 0.25. (c) Three-color flow cytometric analysis of Th1s and Th2s derived from naive T cells. CD4+ splenic T cells from D011.10 TCR-α/β transgenic mice were driven to Th1 or Th2 subsets in a 6-d culture. They were then stimulated with PMA/ionomycin, stained, and analyzed as in b. Cytokines in the culture supernatants (day 3) were (IFN-γ versus IL-5, ng/ml): Th1 line, 2.6 versus <0.02; Th2 line, <0.01 versus 0.52. Results are representative of five experiments.