
Figure 3.
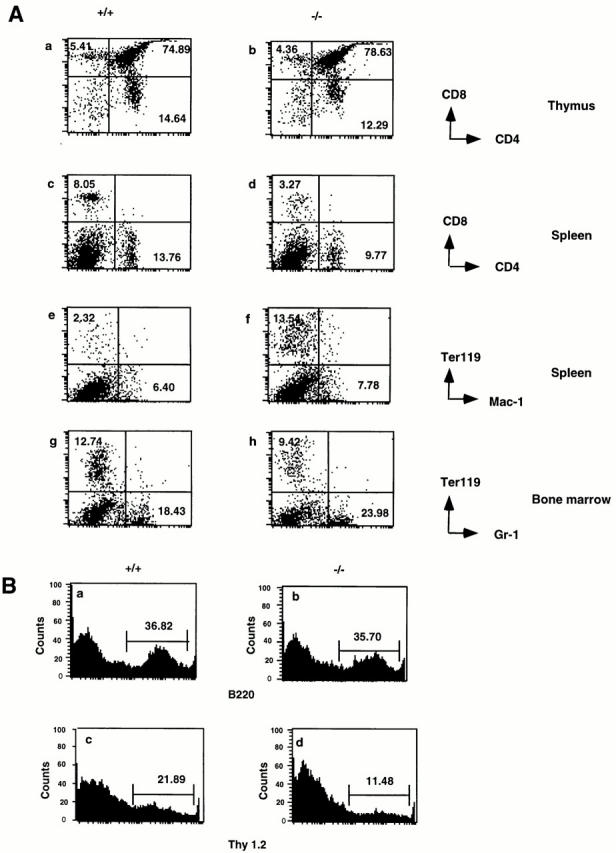
Flow cytometry analysis of hematopoietic cells in p105−/− mice. (A) Thymocytes stained for CD4 and CD8 (a and b), splenocytes stained for CD4 and CD8 (c and d) or Mac-1 and Ter 119 (e and f ), and bone marrow cells stained for Gr-1 and Ter 119 (g and h) from 6-wk-old control (+/+; a, c, e, and g), and p105−/− (−/−; b, d, f, and h) mice. Percentages of positive cells are indicated. (B) Histogram of the relative number of splenocytes stained with B220 (a and b) or Thy 1.2 (c and d) from 6-wk-old control (+/+; a and c), and p105 −/− (−/−; b and d).