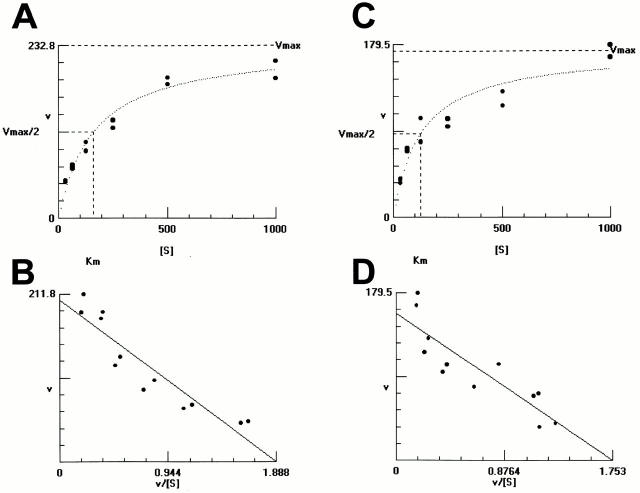
Figure 3.
Protein C activation by cultured endothelial cells. Protein C was incubated with venous (A and B) or arterial (C and D) endothelial cells in the presence of thrombin, and generated APC was measured. The y-axis represents velocity of APC generation (pM/min) in the presence of indicated concentrations of protein C (A and C). The Vmax and K d values were calculated by the Eadie-Hostee plot (B and D).

