Figure 1.

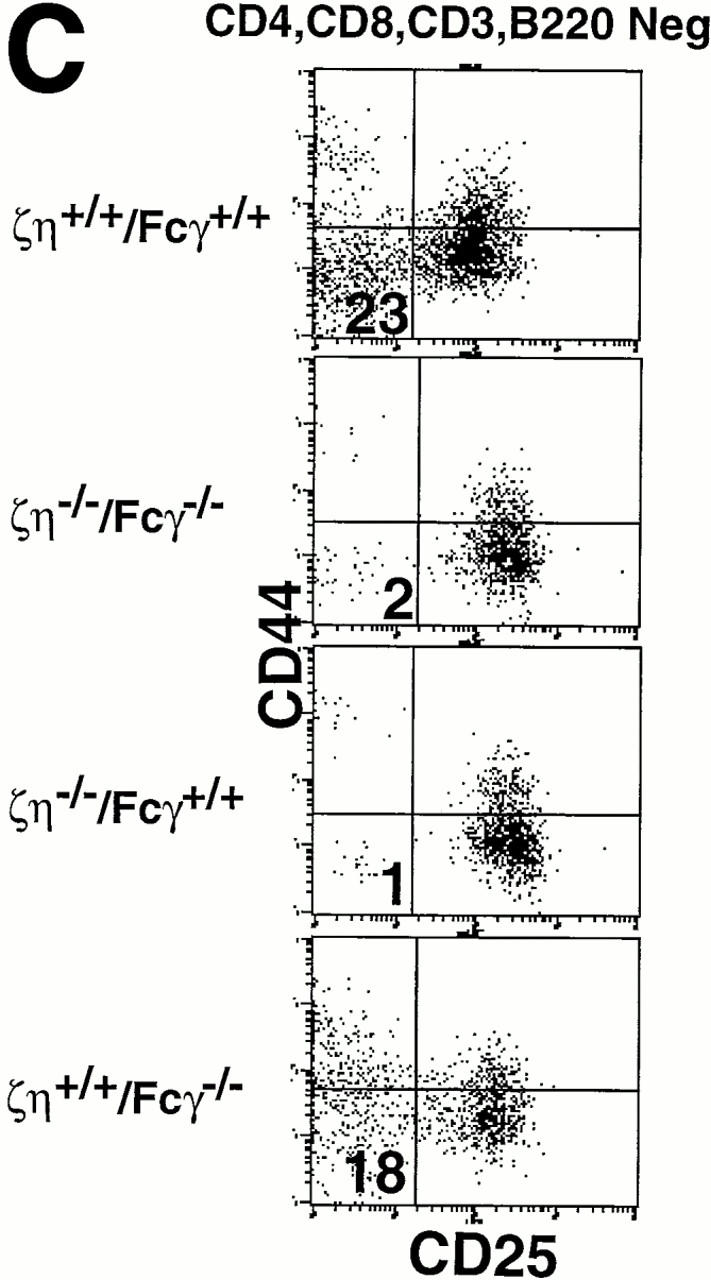
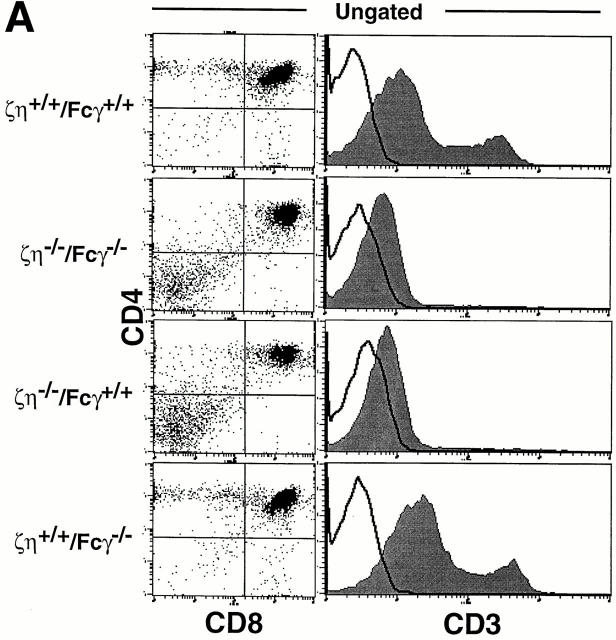
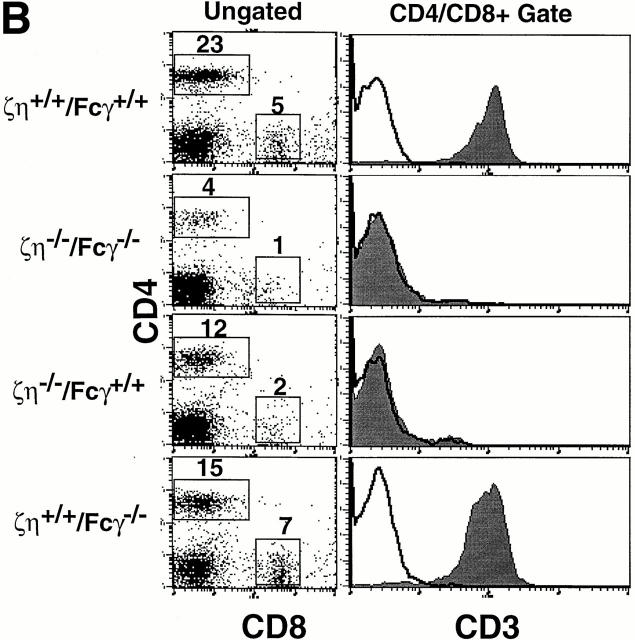
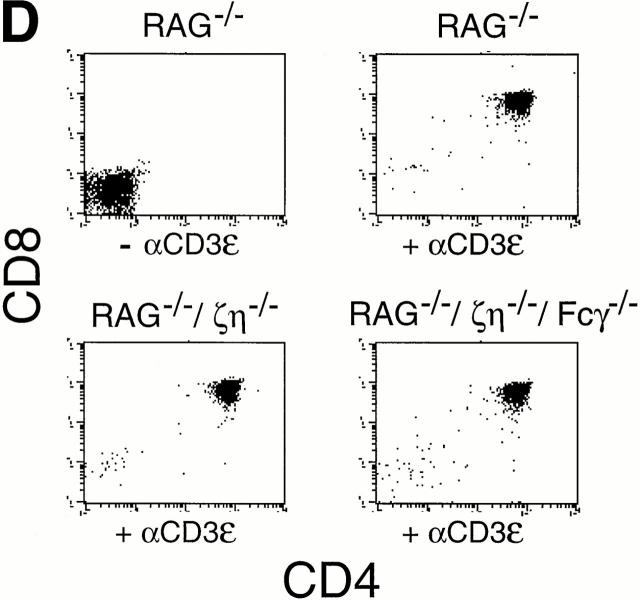
Phenotypic analysis of thymocytes and T cells from ζ/η+/+–Fcγ+/+, ζ/η−/−–Fcγ−/− , ζ/η−/−–Fcγ+/+, and ζ/η+/+–Fcγ−/− mice. (A) CD4, CD8, and CD3 expression on total thymocytes. (B) CD4 versus CD8 expression on ungated splenocytes. CD3 expression is shown on CD4+ and CD8+ gated splenocytes (CD4+/CD8+). (C) CD25 versus CD44 expression on gated (CD4−CD8−CD3−B220−) thymocytes. Immunofluorescence and flow cytometric analysis was performed with thymocytes and splenocytes from young adult (4–8 wk-old) mice. Shaded areas represent staining with experimental antibodies and solid lines represent staining with negative control antibody. Numbers in quadrants of dual parameter histograms represent the percentage of cells contained within that quadrant. (D) Induction of CD4+CD8+ thymocytes in RAG1−/−, ζ/η−/− and in RAG1−/−, ζ/η−/−–Fcγ−/− mice by anti-CD3-ε antibodies. 6–12-wk-old mice were injected intraperitoneally with 200 μl PBS containing 75 μg of affinity purified CD3-ε specific antibody 145-2C11. Control animals were injected with 200 μl PBS. 6 d after injection, thymocytes were counted and analyzed by flow cytometry for expression of CD4 and CD8. Results shown are representative of three separate experiments for each genotype.


