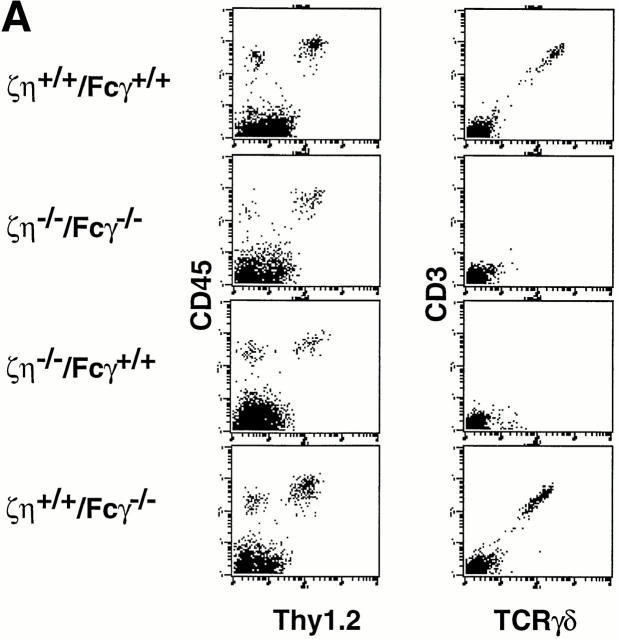
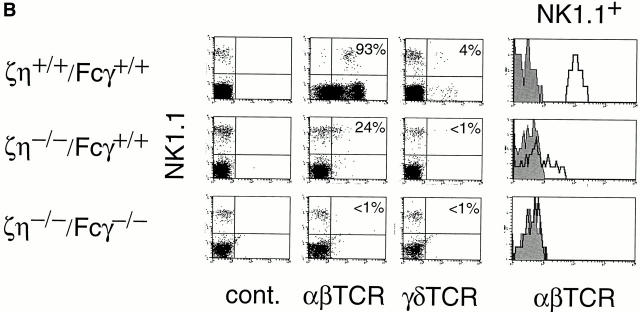
Figure 6.
Phenotype of DETC and DN NK1.1+ thymocytes from ζ/η+/+–Fcγ+/+, ζ/η−/−–Fcγ+/+, ζ/η+/+–Fcγ−/−, and ζ/η−/−–Fcγ−/− mice. (A) DETCs were purified as described in Materials and Methods and stained with antibodies directed against TCR-γδ and CD3-ε or Thy 1 and CD45. (B) Expression of surface TCR on NK1.1+ thymocytes from ζ/η+/+–Fcγ+/+, ζ/η−/−–Fcγ+/+ and ζ/η−/−–Fcγ−/− mice. Shown are two-color plots of NK1.1 versus. α/β-TCR or γ/δ-TCR on gated (CD24−) thymocytes. Numbers in quadrants refer to percent of NK1.1+ thymocytes that express TCR (α/β-TCR or γ/δ-TCR). Single-color plots show expression of α/β-TCR on gated NK1.1+ thymocytes. Shaded areas in single color histograms represent staining with negative control antibodies.


