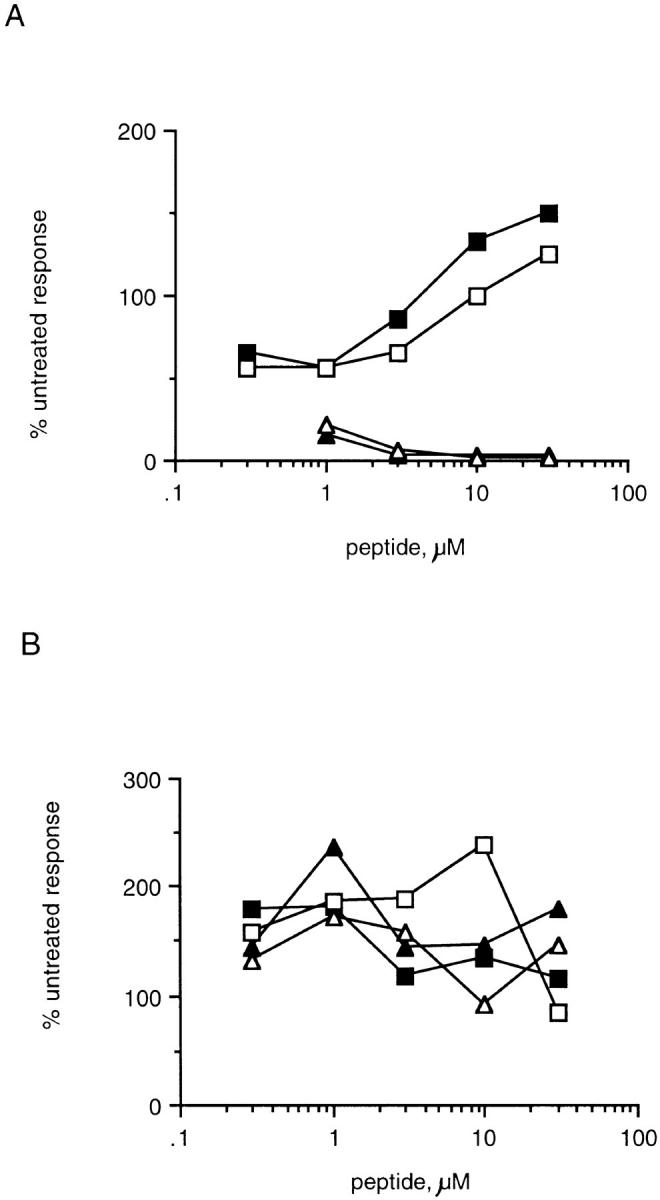
Figure 4.

Comparison of the responses of Eα6 and control 1H3.1 to Eα52–66 and Eα52–68 in the presence or absence of inhibitors of processing. (A) Proliferative responses of Eα6. (B) IL-2 production by 1H3.1 as measured by CTLL assay. Both panels show the fold response to Eα peptides loaded onto APCs in the presence of inhibitors of processing as a percentage of the fold response to Eα peptides loaded onto APCs in the absence of inhibitors of processing. Some of the responses shown are >100%, because the background response was lower in the samples in which inhibitors of processing were included. Thus, although maximum cpm achieved in the presence of the inhibitors was lower than in the absence of the inhibitors, the fold response was greater in the presence of the inhibitors. □, ▵, chloroquine; ▪,▴, ammonium chloride. □, ▪, Eα52–66; ▴, ▵, Eα52–68.
