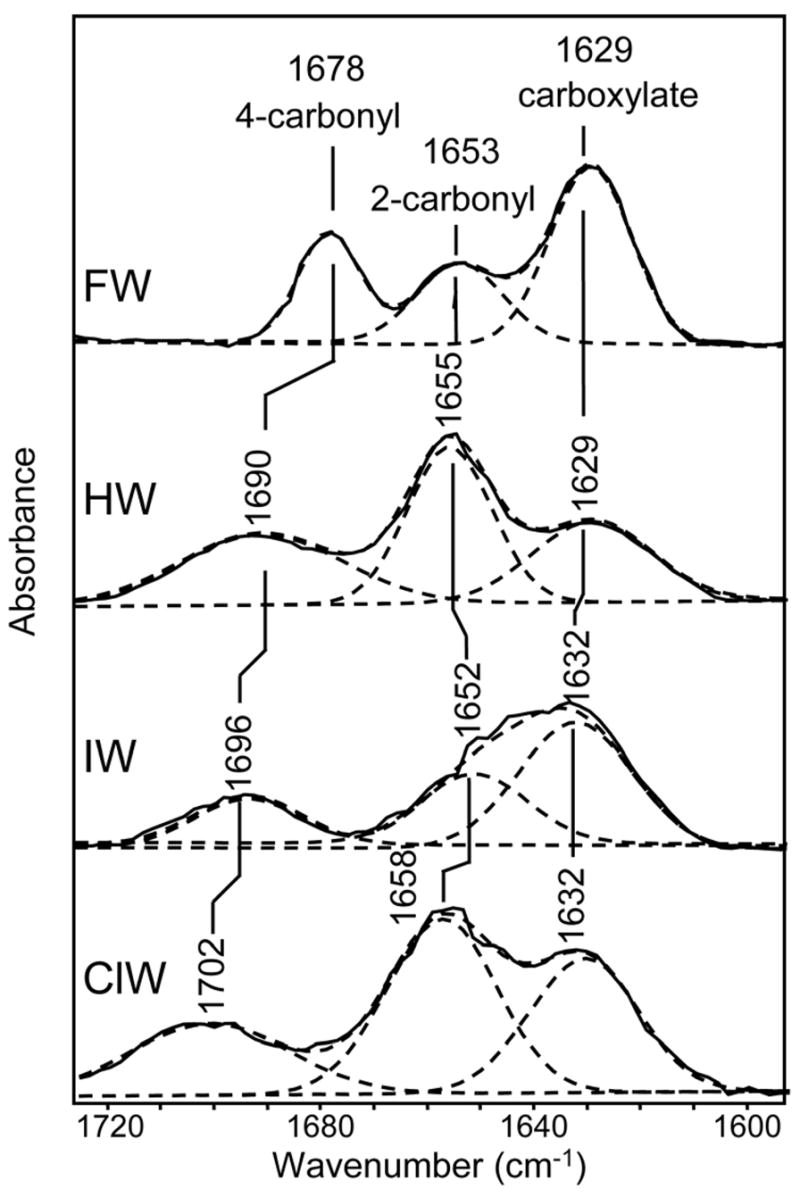
Figure 4. Environment of willardiines free in solution.

Difference FTIR spectra in the region of 1580–1740 cm−1 between FW and buffer, HW and buffer, IW and buffer, and ClW and buffer.

Difference FTIR spectra in the region of 1580–1740 cm−1 between FW and buffer, HW and buffer, IW and buffer, and ClW and buffer.