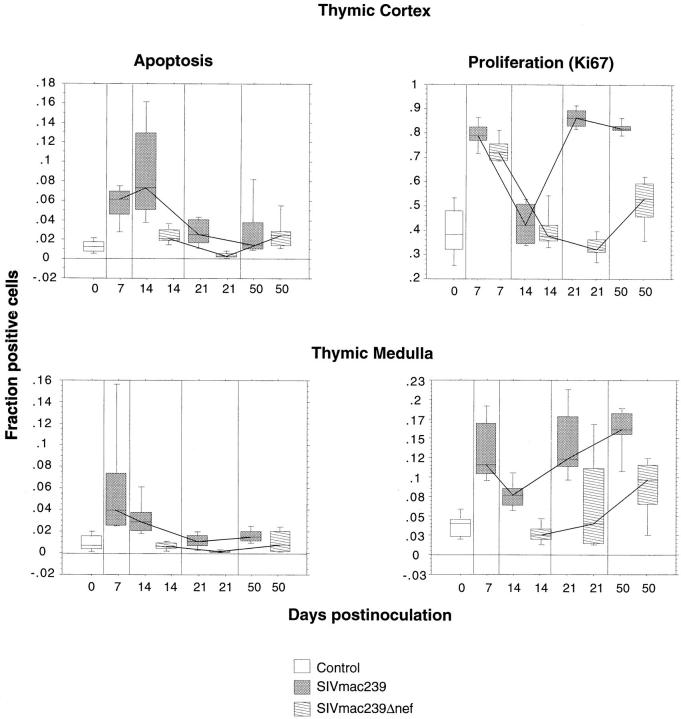
Figure 4.
Apoptosis and cellular proliferation in the thymus during SIV infection. Alterations in cell proliferation and apoptosis in the thymic cortex and medulla were examined by morphometry in sections of thymus from animals infected with pathogenic SIVmac239 or nonpathogenic SIVmac239Δnef and compared with four uninfected control animals. Results are illustrated as box-plots and median traces. The box plots are based on 10 observations (20 for the controls), 5 from each animal. Each box-plot represents pooled data from two animals infected with the same virus or four uninfected age-matched controls. To examine cell proliferation, the fraction of cells positive for the Ki67 nuclear proliferation antigen were measured separately in the cortex and medulla using a Quantimet 570c image analyzer. The fraction of cells undergoing apoptosis was similarly determined after sections were subjected to in situ end labeling using the Apotag kit. The most dramatic changes occurred in the thymic cortex of animals infected with SIVmac239, where there was an increase in apoptosis at 14 dpi followed by an increase in proliferation at 21–50 dpi. Note that the scale of the Y axis for proliferation in the thymic cortex goes to 1, indicating that at 21 and 50 dpi nearly all of the cells in the cortex were proliferating. With the exception of an early increase in proliferation in the cortex, animals infected with SIVmac239Δnef showed no significant differences from the uninfected control group.

