Figure 3.
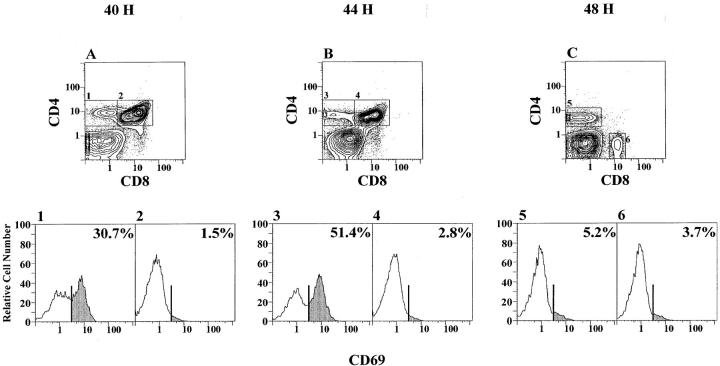
Changes in the expression of CD69 on T cell subsets during marrow cultures. C57BL/Ka marrow cells were depleted of α/β T cells and cultured for 40 (A), 44 (B), and 48 (C) h as was shown in Fig. 2, F–H. Gated CD4+CD8med or CD4+CD8− cells (boxes 1, 3, and 5) or CD4+ CD8+ cells (boxes 2 and 4) or CD4−CD8+ cells (box 6) were analyzed for the expression of CD69. The profiles and percentages of CD69+ cells in each box are shown in corresponding panels 1–6. Shaded areas show the CD69+ cells.

