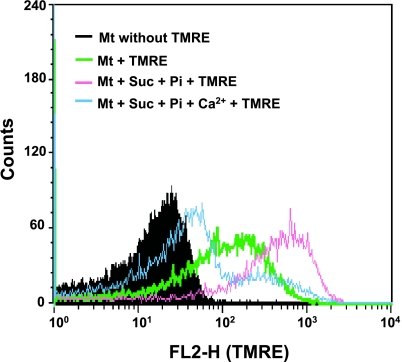
Fig. 2.
Effect of succinate and Ca2+ on TMRE fluorescence intensity. Membrane depolarization was analyzed by flow cytometry for changes in FL2-H in the gated R1 events. Membrane potential was detected by TMRE. Mitochondrial background fluorescence (without TMRE staining) (black area). Membrane potential in the absence of Pi and succinate (Suc) (green line) and in the presence of Pi and Suc (pink line). Induction of membrane depolarization by 40 µM Ca2+ for 5 min incubation in the presence of respiratory substrate (blue line). Similar results were obtained in 3 separate experiments.

