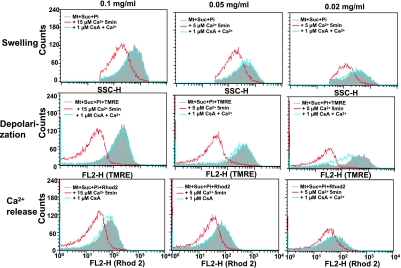
Fig. 4.
Effect of mitochondrial concentration on the flow cytometric analysis of mitochondrial functions. Experimental conditions were the same as described in Fig. 3. Used mitochondrial concentrations were 0.02 to 0.1 mg/ml. Used Ca2+ concentrations were 5∼15 µM. Similar results were obtained in 3 separate experiments.

