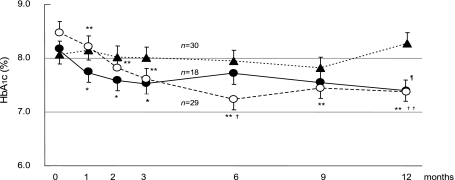
Fig. 1.
HbA1c levels after intervention in the group M (closed circle), D (open circle) and C (closed triangle). The data are expressed as means ± SE. *Significant difference from the baseline (p<0.05). **Significant difference from the baseline (p<0.01). ¶M group vs C group (p<0.05). †D group vs C group (p<0.05). ††D group vs C group (p<0.01).

