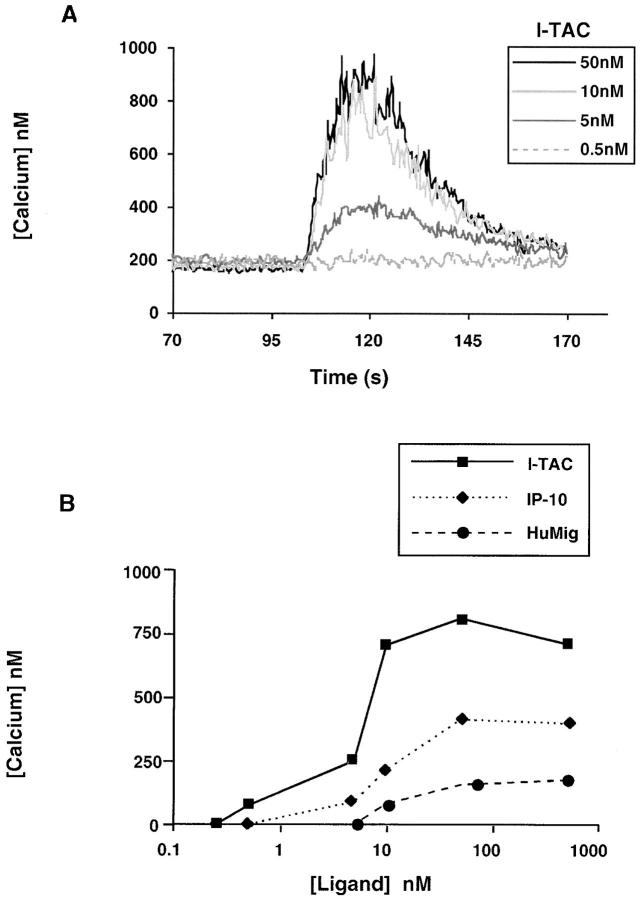
Figure 5.
Mobilization of intracellular calcium in activated T cells. (A) Concentration-dependent [Ca2+]i changes induced by I-TAC in IL-2–stimulated T cell blasts. I-TAC was added at 50, 10, 5, and 0.5 nM to INDO-1–loaded cells and [Ca2+]i-dependent fluorescence changes were recorded. The data shown is from one representative experiment of at least four separate experiments using cells from different donors. (B) Dose- response curves of I-TAC, IP-10, and HuMig on IL-2–stimulated T cell blasts. Chemokine was added at 0.25, 0.5, 5, 10, 50, and 500 nM to INDO-1–loaded cells and intracellular [Ca2+] changes were monitored as above. These data are compiled from two separate experiments using cells from different donors.

