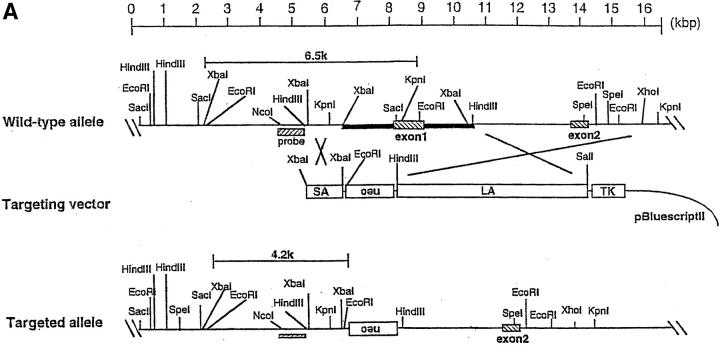
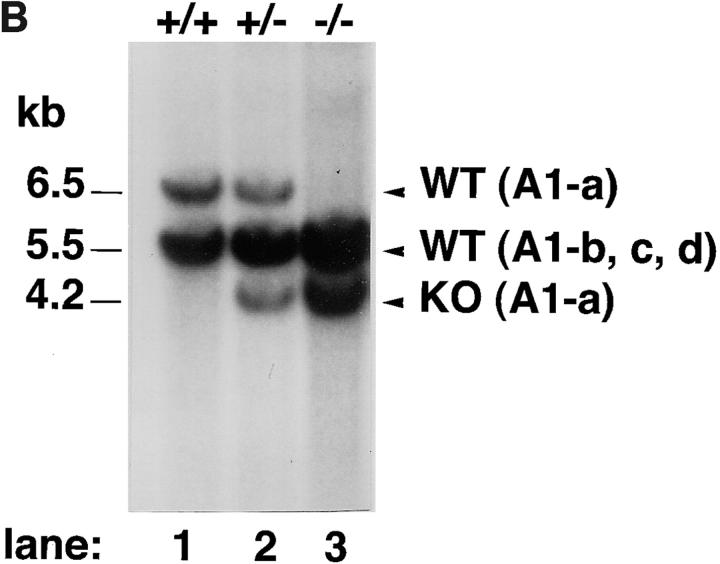
Figure 2.
Targeted disruption of the mouse A1-a gene. (A) Structure of the targeting vector, pA1-a-KO-neo, restriction map of the mouse A1-a gene, and structure of the mutated locus after homologous recombination. The coding exons are depicted by hatched boxes. The genomic fragment used as a probe for Southern blotting is shown as a hatched bar. neo was placed in a reverse orientation relative to the A1 transcription. The expected sizes of the EcoRI fragments that hybridize with the probe are indicated. (B) Southern blot analysis of genomic DNA extracted from ES cells. The DNA was digested with EcoRI and hybridized with the probe. The sizes of wild-type A1-a (WT (A1-a)), wild-types A1-b–d (WT A1-b, c, d), and disrupted (KO (A1-a)) alleles are shown; the genotypes are presented above the lanes.


