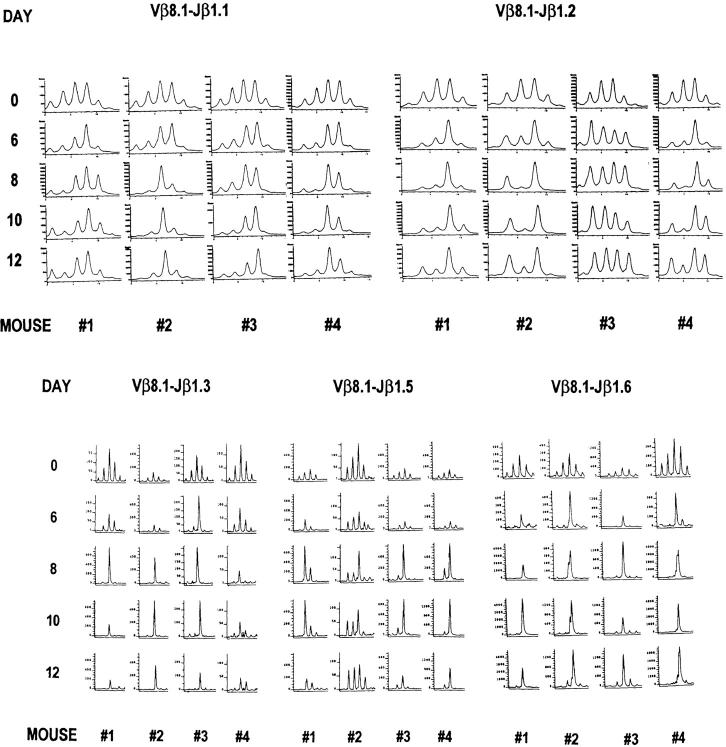
Figure 5.
Preservation of Vβ8.1 spectratypes during the T cell apoptosis phase from days 8 to 12 after LCMV infection. The representative CDR3 profiles from the PB of four acutely LCMV-infected mice 6–12 d after infection are displayed. Since the naive spectratypes invariably have a normal Gaussian distribution, we plot at the top of each column day 0 spectratypes from two naive control mice. To avoid traumatizing the mice at the time of LCMV infection, day 0 samples were not taken from the same mice analyzed on the subsequent days. The PCR products were subjected to run-off reactions using [γ-33P]ATP-labeled (Jβ1.1 and Jβ1.2) or fluorescent (Jβ1.3, Jβ1.5, and Jβ1.6) Jβ primers.

