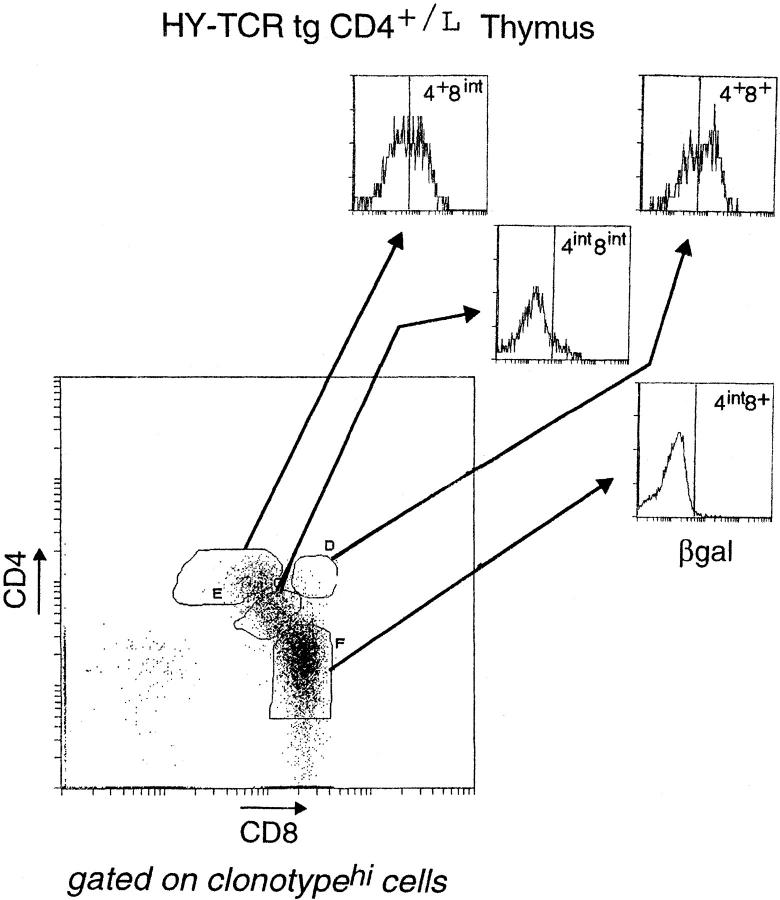
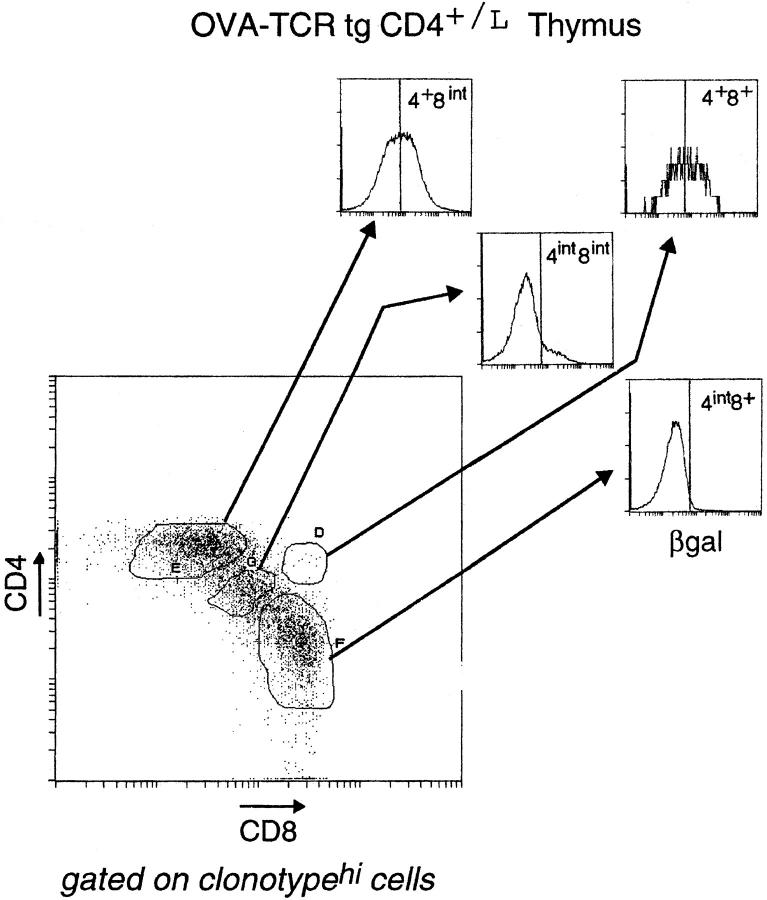
Figure 7.
βgal expression in thymocyte populations of HY TCR tg and OVA TCR tg mice. Thymocytes from HY-TCRtgCD4+/L and OVA-TCRtgCD4+/L mice were analyzed by four-color flow cytometry. CD4/CD8 profiles of thymocytes expressing the transgene-encoded TCR (as distinguished by T3.70 for the HY TCR and anti-Vα2 for the OVA TCR) are shown. Thymocyte subpopulations were further defined (see the legend to Fig. 3) and analyzed for βgal expression.


