Figure 2.
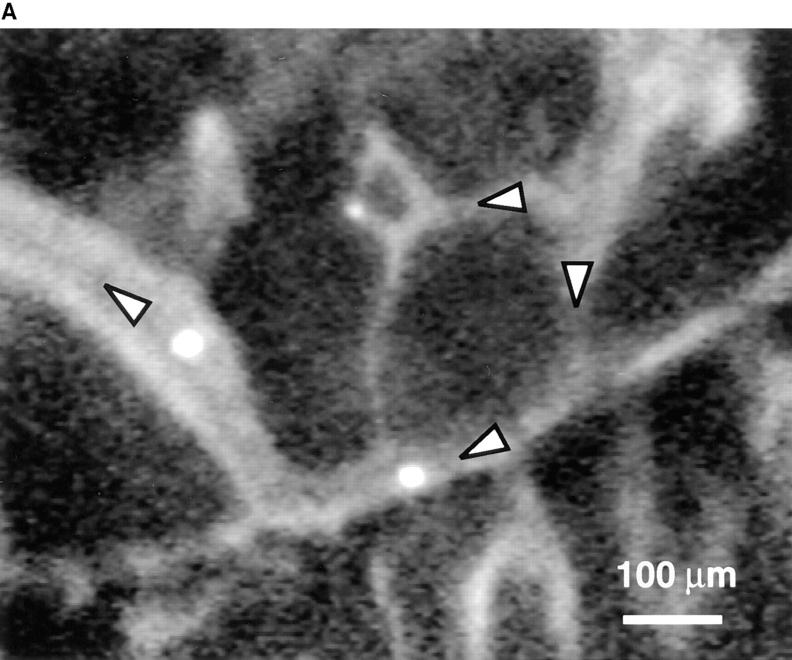
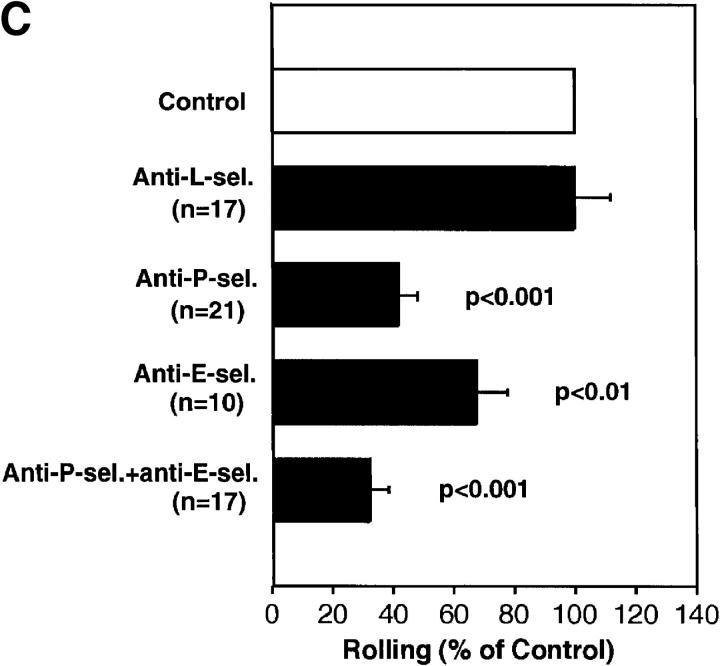
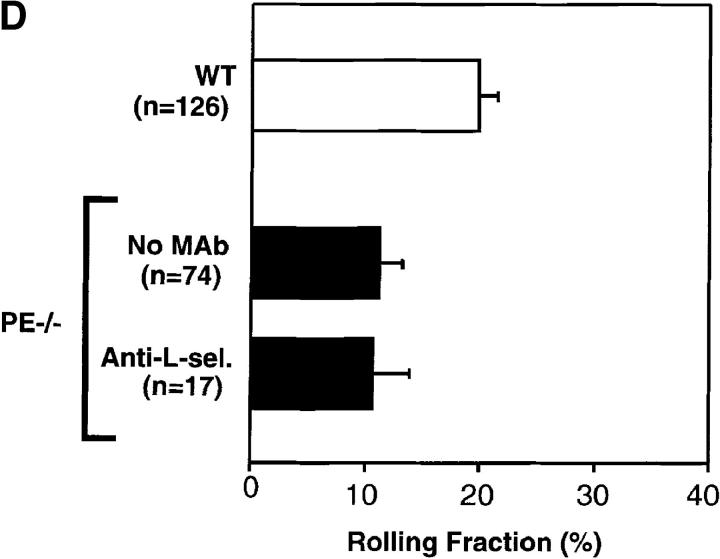
FDCP-mix cells roll in BM venules and sinusoids. (A) Micrograph of a segment of the right parietal sinusoidal network. Blood flow in some vessels is indicated by arrowheads. To improve contrast between the intra- and extravascular compartment, this animal was injected intravenously with low-dose FITC-dextran (150 kD, 10 mg/g body weight). Three BCECF-labeled FDCP-mix cells (bright intravascular dots) can be seen. (B) Comparison of FDCP-mix cell rolling fractions in BM and bone venules. Rolling fractions in all types of BM venules and sinusoids were significantly higher than in BVs (Student's two-tailed t test for unpaired data). Therefore, data from BM vessels were pooled for this figure. Data are shown as mean ± SEM. n, number of venules. (C) Role of selectins in FDCP-mix cell rolling in wild-type mice. FDCP-mix cell rolling was measured in the same BM vessels before and after injection of anti–P- and/or anti–E-selectin mAbs (100 μg/mouse) or treatment of cells with anti– L-selectin mAb (100 μg/107 cells). Each bar represents the mean ± SEM of three experiments. n corresponds to the number of venules. Groups were compared with control using the Kruskal-Wallis test followed by Bonferoni correction of P. (D) Comparison of FDCP-mix cell rolling in wild-type and P/E-selectin double knockout mice. Data are expressed as mean ± SEM of three experiments. Rolling fractions in P/E-deficient mice were significantly lower than in wild-type littermates (P <0.001; Student's t test), but were not affected by anti–L-selectin mAb (100 μg/107 cells). n, number of venules.


