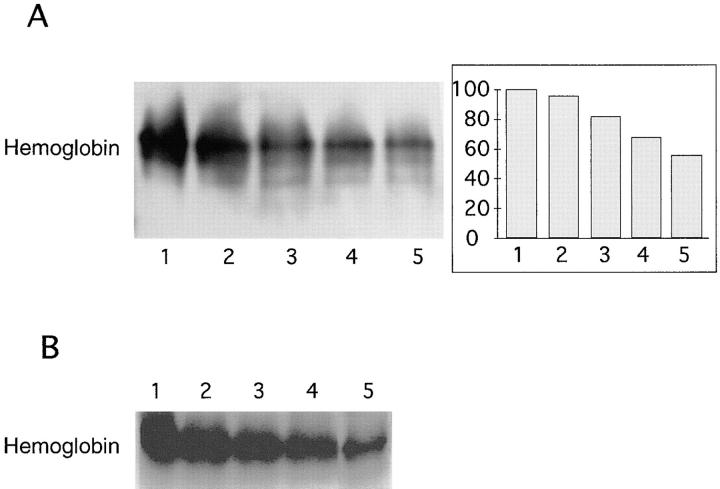
Figure 6.
Hemoglobin protease activity by Hbp at different pH. Hemoglobin was incubated with purified Hbp, as described in Materials and Methods. Samples were analyzed by nondenaturing PAGE and PhotoImaging. (A) Hemoglobin visualized by means of chemiluminescence. Lane 1, hemoglobin not incubated with Hbp, pH 6.0; lanes 2–5, hemoglobin incubated with Hbp at pH 8.0, 7.0, 6.5, and 6.0, respectively. A quantitation of the PhotoImage data is presented at the right hand of the image. The initial amount of hemoglobin present in the reaction mixture was set at 100%. (B) Hemoglobin visualized by means of Coomassie R-250 staining. Lanes 1–5, same samples as in A.

