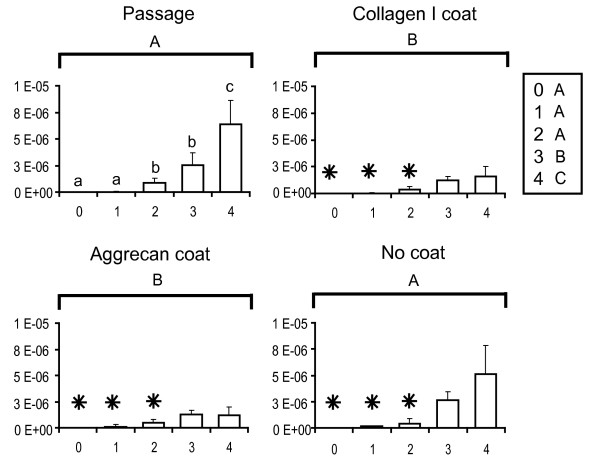
Figure 2.
Collagen I gene expression profiles of meniscal fibrochondrocytes. The x-axis refers to the passage number, and the y-axis to the gene expression abundance (in the exponent notation used, 'E-n' stands for '× 10-n'). Small letters denote significant differences with passage, using a one-way analysis of variance (top left). Capital letters denote significant differences between levels (passage, collagen I coating, aggrecan coating and no coating), using a two-way analysis of variance. Stars denote groups that are not significantly different from values of the primary cells (that is, the P0 value in the top left panel), using an interaction term between the two factors.

