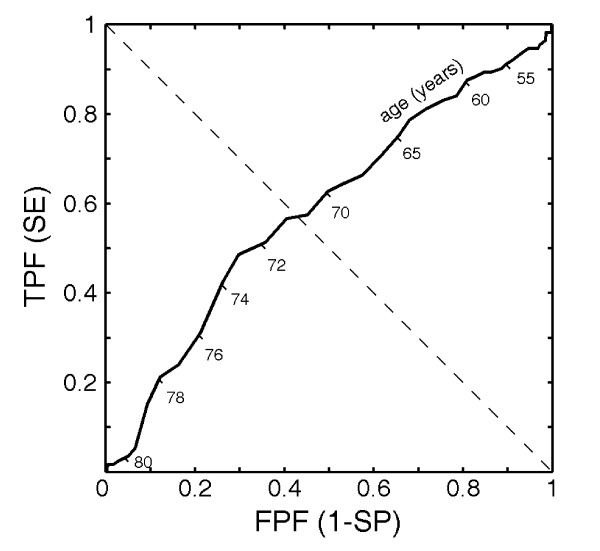
Figure 1.
Example of a receiver operating characteristic (ROC) curve obtained using patient age as only predictor. Numerical values of ages are plotted under the ROC line. FPF and TPF denote false-positive and true-positive fractions, respectively. Diagonal dashed line intersects ROC curve at point where sensitivity (SE) and specificity (SP) are equal (71 years in the example).

