Figure 3.

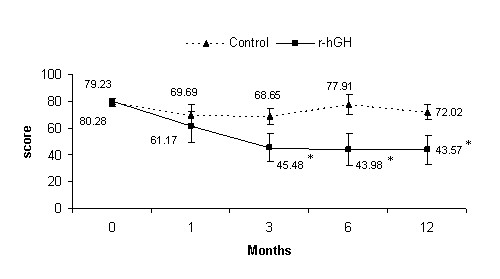
Mean (CI) total score of Fibromyalgia Impact Questionnaire. *p < 0.05 vs control group (ANCOVA); p = 0.001 time course within-group comparisons (repeated measures ANOVA).

Mean (CI) total score of Fibromyalgia Impact Questionnaire. *p < 0.05 vs control group (ANCOVA); p = 0.001 time course within-group comparisons (repeated measures ANOVA).