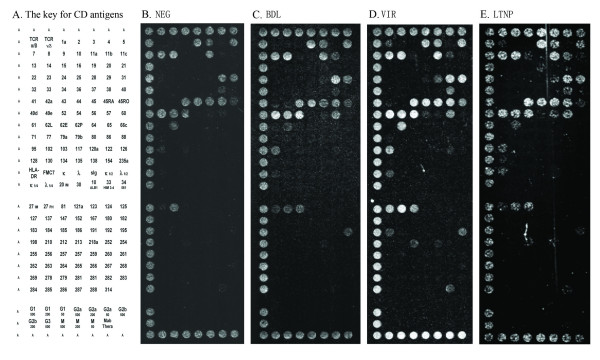
Figure 4.
Composite dot scan patterns of antibody binding for CD8+ T cells. Half of a duplicate array was shown with the alignment dots "A" at left, top and bottom. Alignment dots are a mixture of CD44 and CD29 antibodies. (A) The key for CD antigens on the DotScan array, (B) NEG, (C) BDL, (D) VIR and (E) LTNP. Binding patterns shown here are representatives from each group. They may not fully reflect all the significant antigens from statistical analysis because of individual variability in antigen expression.

