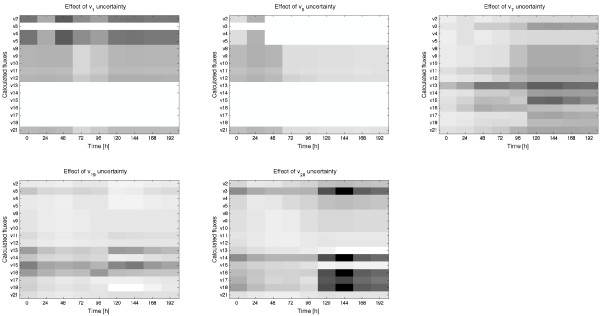
Figure 11.
Effect of the uncertainty of each measured flux over the imprecision of the estimated fluxes along time. The figures show the reduction of the imprecision of the estimated (or calculated) fluxes when the uncertainty of the measured flux is decreased a 3%. The reductions are quantified between 0% (white colour) and 100% (black).

