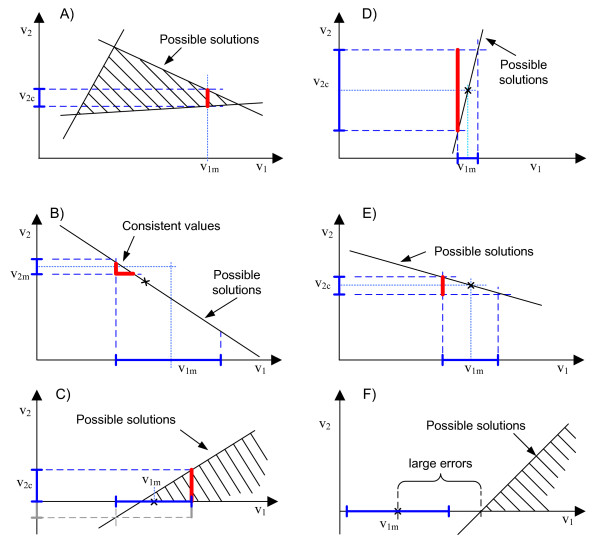
Figure 3.
Flux spectrum approach in use. Each figure shows a schematic projection of a high-dimensional flux space into two dimensions. The space of possible solutions (before taken into account v1 and v2) is represented by a polygon or a solid black line and tagged with a label. Subindex m denotes a measured flux, and c a calculated one. The band of uncertainty around measured fluxes is represented with a blue, solid interval in the axis. The estimations provided by FSA are represented with red, thick lines. Dotted lines are just auxiliary projections. (A) Underdetermined case. The interval of possible values for v2 is computed even when the system is underdetermined. (B) Determined and redundant case. Both fluxes are measured, but its values are inconsistent. With the band of uncertainty used, all the values of v1 and v2 within the red line are considered valid. Due to the shape of the band, the values given by a least squares adjustment (denoted with an x) are not considered as a valid solution. (C) Reversibility constraints. A reversibility constraint reduces the interval of possible values for v2. (D) Detection of sensitivity problems. The strangely large interval of possible values for v2 may indicate a problem of sensitivity. (E) Representation of uncertainty. A non-measured flux is estimated from an uncertain measurement. (F) Detection of large errors. A large error in the measured flux v1m is detected with the reversibility constraint.

