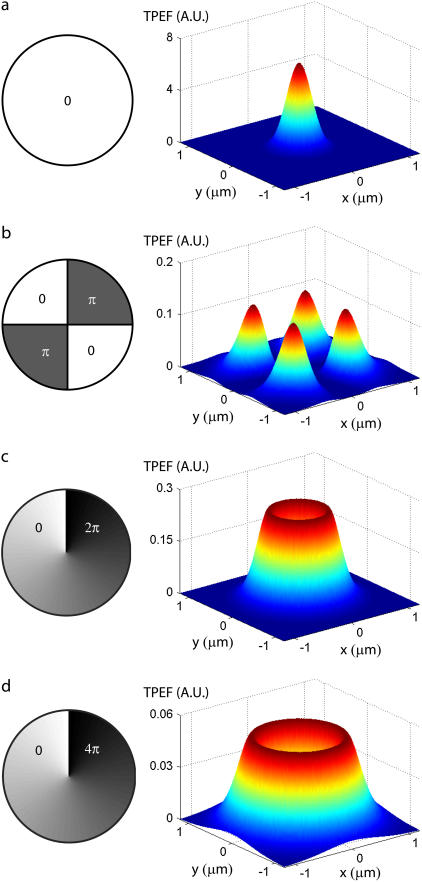
FIGURE 3.
DM-induced aberration profiles in the pupil plane (left) and corresponding theoretical three-dimensional TPEF intensity distributions in the focal plane  (right). Cases are shown with (a) no aberrations, (b) quadrant-phase aberrations of stroke π, (c) spiral-phase aberrations of pitch 2π, and (d) spiral-phase aberrations of pitch 4π. The mean laser wavelength is taken to be 800 nm and the unaberrated illumination field profile at the focal plane is taken to be a Gaussian of waist w0 = 500 nm. See the Appendix for derivation of TPEF intensity distributions.

