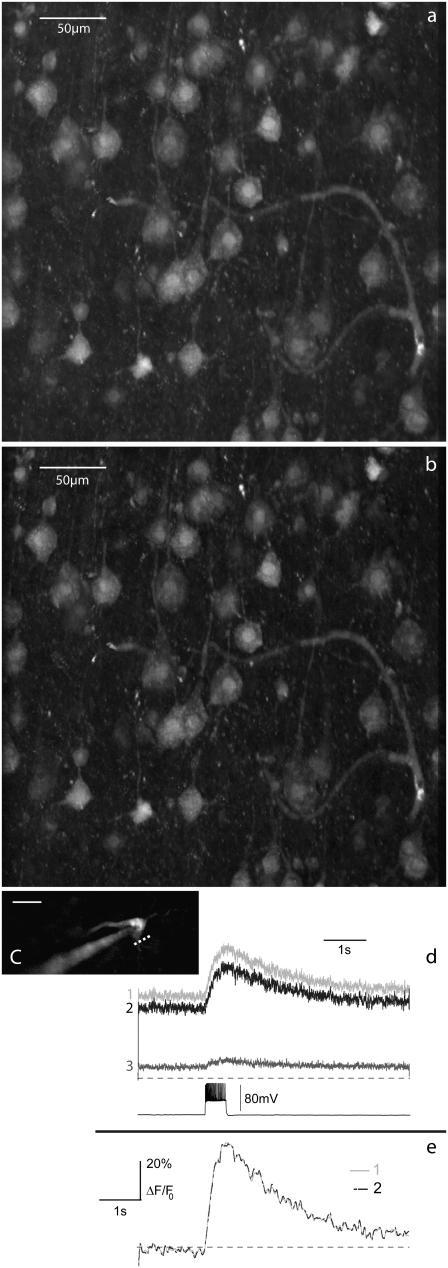
FIGURE 7.
Standard TPEF image (a) and 3π quadrant-phase DA-TPEF image (b) of a section of a medial entorhinal cortex stained with sulforhodamine 101, revealing astrocytes as well as neurons. Images are maximum intensity z-stack projections over 30-μm depth with steps of 2 μm. The DM-induced aberrations were applied during scan flybacks, and DA subtraction was performed line by line. The improvement in signal/background ratio in the DA-TPEF image is slight (as expected) but noticeable. (c) A CA1 pyramidal neuron was patch-clamped and labeled with Calcium Green 1, and calcium imaging was performed by repeatedly scanning a single line (white dashed line in c) at 1-ms intervals. Fluorescence traces in panel d are low-pass filtered at 20 Hz. Normalized ΔF/F0 traces are overlaid in panel e, facilitating a comparison of measurements obtained with standard TPEF (trace 1) and with DA-TPEF (trace 2), where trace 3 corresponds to the background fluorescence obtained with aberrations. The laser wavelength was 810 nm and the power delivered to the sample was ∼4 mW. Images a and b are shown with a γ-factor set to 0.8.

